WASHINGTON – Jump To: THE FORECAST | THE OUTLOOK | THE FACTORS | DID WE GET IT RIGHT LAST YEAR?
Winter is approaching yet again – the sun starts setting earlier, and the holiday decorations go up. Of course, that also means it is time once again to look ahead at what the weather has in store for the D.C. area this season. Will we be needing snow shovels or rain boots? Let’s dive in and find out!
This is a tricky year, and as with any seasonal outlook, nothing is set in stone. No two winters are ever the same, and while an outlook like this is a lot of fun to do, they are never going to be perfect.
The backstory:
Around FOX 5, I often compare long-range and seasonal weather forecasting to a popular pastime for many these days: sports gambling. You can see the players on the field. Statistics can tell you how they have performed in the past, and give you hints at how they may perform in the game ahead, but each game is new, will have unknown surprises and the occasional unpredictable curveball.
With that in mind, let’s give it our best shot! Here is our FOX 5 winter forecast for the upcoming winter of 2025-2026 in the Washington, D.C. region!
- Cold start, milder finish
- Winter average: slightly below normal temperatures
- Average to above-average snowfall
- Slightly above-average shot at a significant snow event (6-12″ in one storm)
- Bold Prediction #1: Coldest Month Compared to Average: December
- Bold Prediction #2: Snowiest Month: January
- Bold Prediction #3: First 1″ of Snow Before Christmas
- Bold Prediction #4: Does D.C. Get a Blizzard Warning? No
FOX 5 DC is favoring a colder-than-normal winter for the mid-Atlantic region in the winter ahead.
Dig deeper:
A typical La Niña, even a weak one, generally favors warmer than normal temperatures during the wintertime months. This La Niña is expected to be a bit different since it is expected to weaken as the winter goes on. Prepare for another long-named climate index, the Southern Oscillation Index, or SOI. In simple terms, where La Niña has to do with the ocean temperatures themselves, the SOI measures the atmospheric response to those values. The SOI is measured by the Australian Bureau of Meteorology on a monthly basis, with their calculations showing the SOI may have just had its highest reading since February 2023. This means that the atmosphere is responding to the La Niña environment.
That being said, we do not believe that the winter ahead is going to be dominated by a La Niña pattern like some of the climate models are projecting. Instead, we believe that MJO cycles, coupled with Sudden Stratospheric Warming (SSW) events, will be a major driving factor in the winter ahead. Essentially, we are expecting a winter with a lot of swings. There will be periods of milder than normal weather, periods of seasonal winter, and periods of more intense cold.
Mike’s favorite analog years (past winters that may be similar to the coming winter) along with D.C.’s departure of normal temperature for each month, along with the seasonal snowfall.
I took a look back at years that had very similar signals, what we call analog years. Going back to 1950, I searched for winters with similar signals of weakening La Niña, similar North Pacific water temperature layout, similar solar numbers, and easterly QBO readings.
The thing that jumped off the page to me right away when looking at these years was that these winters tend to start fast with some strong cold during the month of December, with the month coming in an average of 3°F below normal. Now, that number may be a little on the strong side, given that the very cold Decembers of 1989 and 2000 are both analogs.
Still, even in years not shown as strong analogs, there is a notable favoring of cold December patterns during winters where solar activity is high, QBO is easterly, and La Niña is fading.
Snowfall during December with a similar atmospheric setup to the current December.
Given this, we expect that December will likely come in colder than normal. Perhaps some periods of rather extreme cold. Confidence is aided by longer range model guidance shifting towards a colder solution for next month already. They also indicate the possibility of sustained blocking around Greenland, what forecasters refer to as a negative North Atlantic Oscillation (-NAO) which can aid in the track of storms along the east coast of North America. With this in mind, we think we have a reasonable shot at picking up our first inch of snow before Christmas, something that has not happened since 2017.
Every single strong analog year we had that featured a cold December featured over an inch of snow before the New Year, as shown above. This also places our odds of a white Christmas above normal than for an average year, though this is far from a guarantee.
January tended to be more of a mixed bag. It was an even split in my analog years between colder and milder Januarys. For this month, I’m leaning towards another below-average month. My reasoning is that QBO and SSW impacts tend to be most pronounced during the latter half of the winter. While I am not expecting January to be exceptionally cold, I think we are going to see a lot of back and forth, though our “cold waves” could be on the stronger side even if short-lived.
What an average winter entails at all three area airports: DCA, IAD, and BWI.
Due to the expected back and forth, I think it is our most favorable month for more impactful winter weather. Since 2015, in winters that have featured over 1″ of snow, January has been the snowiest month in more than half of them. We think that pattern holds true this year as well. While we still think that getting a true blizzard in Washington, D.C. (that is, a storm that prompts the National Weather Service to issue blizzard warnings for the District) remains lower than average this winter, we believe that, like last year, one or two significant snowfalls of 6-12″ out of a single storm are possible.
D.C.’s largest single snowfall last season was 7.2″ on January 6, and we believe that our biggest snow of the upcoming winter could be somewhere in that range.
By the current 30-year average, DC’s winter snowfall normal is 13.8″. The split between January and February is even, with January averaging 4.9″ while February averages 5.0″ of snowfall. Why we think January could have the edge in snowfall this year compared to February is clear in the analog chart above. While December showed a strong correlation with cold, perhaps surprisingly, February showed strong correlations with milder than normal conditions.
A typical La Niña favors a storm track west of the Appalachian Mountains, a poor track for big snowfall here in D.C. A fading La Niña should make the storm track more variable.
So, to summarize, we are forecasting a colder-than-average December, with DC’s first inch of snow falling before the end of the month. January we expect will be slightly colder than normal, and we are forecasting it to be the snowiest month of the winter. February we are forecasting milder than normal conditions, though we still expect some snowfall during the month.
While you may think that means early spring, I would not be so sure. Despite the typical warmer than normal weather in the month of February, March in these types of patterns does have a history of being sneaky. Snow fell in March in every single one of my top analogs, with 75% of them featuring measurable snowfall in March. So do not let your guard down even if February is not as chaotic as a typical winter in our region.
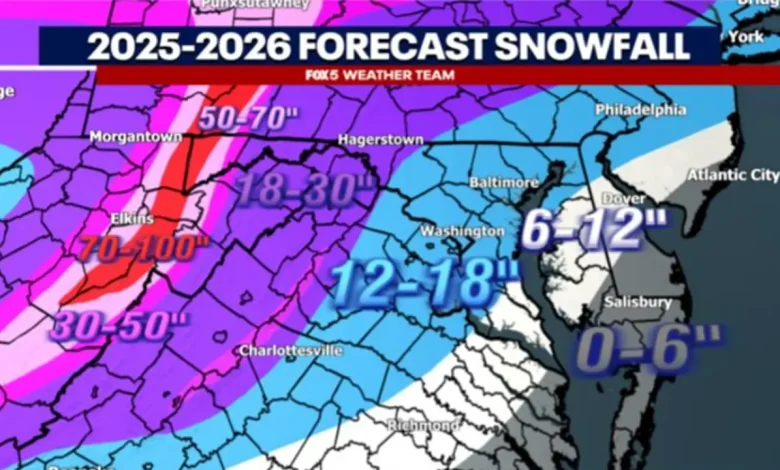
The FOX 5 weather team’s forecast for the upcoming 2025-2026 winter season favors average to slightly above average snowfall for much of the region.
How much snow?:
For snowfall, we are going with average to slightly above average snowfall for the winter ahead. We picked up nearly 16″ of snowfall last year, and a similar number would not shock us this year. I’m forecasting 12-18″ of snow for the 2025-2026 season. My top analogs averaged 9.8″ of snowfall for the winter, which is below the seasonal average of 13.8″. I am leaning towards the higher end of my analogs, though. Call it a gut feeling, but it is driven by my expectations that we will see over an inch of snow during the month of December, something we have not done in seven years in D.C.
A total very similar to last winter (14.9″) would not shock me at all. I think the bulk of this snowfall will come in two to three storms, with the month of January having the best odds of seeing these. While I think the odds of a “blizzard-level storm” are above what they were last year, I still do not see strong pre-winter signals indicating that one is likely this winter. We are “due” as some would say for a bigger blizzard here in DC, but given the forecast, I do think we have made it a full decade since our last true blizzard here in DC in January 2016.
Quick summary of the winter forecast for the 2025-2026 winter for Washington, D.C.
A lot of what I call “puzzle pieces” are factored into a winter outlook. So how do we think these puzzle pieces will all come together?
Weakening La Niña
A weak La Niña is highlighted, which could impact weather patterns in our region this winter.
Back in October we released a little sneak preview for some of the factors we were looking at when looking at the winter ahead. In that article we spoke about a La Niña and what it can mean for the D.C. region in terms of snowfall.
La Niña happens when ocean waters in the tropical Pacific are cooler than normal. Those cooler waters help impact wind and jet stream patterns across the United States, often forcing the jet stream farther north. When that happens, storm systems often track across the interior of the country, dragging up warm air on southern winds ahead of them. This generally leaves our region warmer and drier than normal for the winter months.
When La Niña begins to fade or weaken, its grip on the atmosphere loosens. That means the weather pattern becomes less predictable and can shift around more easily. This is not such a bad thing for those who enjoy snow in our region. Shifting weather patterns are typically stormy ones, though when we are talking La Niña, those storms are typically more rain than snow. Just like last year, however, it only takes one or two storms to be mostly snow to get you an above normal snow season in the DC region.
Eurasian Snow Coverage: The Snow Advance Index
Snowfall in Siberia can impact the strength of cold air that impacts the D.C. region later in the winter.
A relatively new tool in a weather forecaster’s arsenal, the Snow Advance Index, or SAI for short, is a measurement of how quickly snow cover builds in Siberia during the early autumn, with research indicating that the key month for this index is the month of October. The key is not so much how much snow falls, but how much ground area is covered by snowfall. The speed of expansion is key to the index.
So why does this matter? Well, snow cover is white in color, and white is very reflective. This large area of snow cover reflects more solar energy back into space, leading to a colder air mass to form over the snowy region. This cooling strengthens the development of a large, dense area of high pressure known as the Siberian High.
The stronger Siberian High can disrupt the upper-level wind pattern around the North Pole, often called the Polar Vortex. This disruption can weaken the vortex and cause it to stretch or shift south. This disruption can correlate with a prolonged negative phase of the Arctic Oscillation, or AO for short. A negative AO means the usual tight circulation of cold air near the pole loosens up, allowing frigid air to “leak” southward into the mid-latitudes, including North America.
The index is tracked by Dr. Judah Cohen from Atmospheric and Environmental Research (AER) and he has stated that the SAI will likely finish positive this October, thanks to a very strong start earlier in the month. Just like a weakening La Niña, this is another factor that suggests we are in for more of an unsettled winter ahead.
North Pacific Warm Blob
A “warm blob” in the Pacific could influence the upcoming winter pattern.
The North Pacific Warm Blob is not some Hollywood monster. Instead, it is an area in the North Pacific Ocean where water temperatures are well above their seasonal average. This is not a small area either, it’s thousands of square miles of warmer-than-average waters centered in the North Pacific, south of the Aleutian Islands.
Based on our analysis, when this feature has been present and paired with slightly cooler than normal water temperatures in the central Pacific, double-digit snowfalls have happened just over 50% of the time. A coin flip, it would seem, but most years with a La Niña leaning typically feature below normal snowfall.
The warm waters in this region could help keep the jet stream elevated, which may send it periodically diving southward across the eastern half of the eastern half of the United States, bringing cold air along for the ride. It also will likely keep the storm pattern active across the northern Pacific Ocean, and its storms hitting the west coast that provide the upper-level energy needed to develop stronger storms for the East Coast.
While I would not expect this to be the driving force of the winter, I do think it is something that will play the occasional role. Another piece to the winter puzzle.
Quasi-Biennial Oscillation
The quasi-biennial oscillation (QBO) has to do with the direction of winds in the stratosphere.
A climate signal that you likely have not heard too much about, the Quasi-Biennial Oscillation, or QBO for short, is a regular back-and-forth switch in the direction of strong winds high up in Earth’s atmosphere, specifically in the stratosphere over the equator.
These winds alternate between blowing from the east (easterly) and from the west (westerly) roughly every two years, which is where its name comes from. This pattern slowly descends downward through the atmosphere over time and can influence our weather patterns across the Northern Hemisphere.
A weaker polar vortex causes waves in the jet stream, allowing Arctic cold to push farther south.
This year, the QBO will be in its easterly phase, and is forecast to stay there through the duration of the upcoming winter. So why does this matter for our region? It is all about how these winds can influence the pattern across the arctic region. Similar to how the impacts from Eurasian snowfall are indirect in that they can influence the strength of the Polar Vortex, the QBO can either help promote a stronger or weaker polar vortex.
In the case of an easterly QBO, the easterly winds in the tropics modify the path of atmospheric waves, causing them to break more vigorously near the North Pole. This effectively weakens and disrupts the Stratospheric Polar Vortex. Then, just like the SAI, it can help promote a negative phase of the Arctic Oscillation (AO) which promotes the frequency of cold air outbreaks across parts of the United States, including us here in the Mid-Atlantic.
Two key features, the Arctic Oscillation (AO) and North Atlantic Oscillation (NAO) are blocking patterns that can force storms to take a southern track, increasing snow potential.
Local perspective:
Some of Washington, D.C.’s most memorable winters have come with the QBO in its easterly phase. The multi-blizzard winter of 2009-2010 (56.1″) was an easterly QBO winter, as was 2002-2003 (29.0″)…though these years were also coupled with an El Niño. When paired with a La Niña, the results are a little more mixed, though there are still some major snowfall seasons, like 1978-1979 (22.1″) and 1959-1960 (41.4″). In all, of the 31 winters winter an easterly phase of the QBO recorded since 1950, a whopping 74% of them have featured double-digit snowfall for the DC region by the end of the winter season.
Solar Cycle 25 Progression
We are more than halfway through our current solar cycle, through still in a period of high sunspot activity, indicating an active solar energy environment.
We are just beyond the peak of Solar Cycle 25, the current solar cycle, which happened during the summer of 2025. Still, we are generally on the upper end of solar activity for this particular cycle.
Why you should care:
When the Sun goes through periods of high solar activity, it gives off more energy in the form of solar flares and sunspots. That extra energy can warm the upper atmosphere just a bit, and that tends to strengthen the polar vortex, the cold air that typically is locked up near the North Pole.
Now, when the polar vortex is strong, it keeps all that Arctic air locked up to the north, meaning we’re more likely to see milder, less snowy winters here at home. However, again, it is just another piece of the winter puzzle.
For example, past winters with elevated solar activity paired with an easterly QBO as discussed in the section above, can actually lead to some stronger cold air outbreaks in our region. Something we have taken note of for the forecast ahead.
The Wild Card: The Madden-Julian Oscillation
The Madden-Julian Oscillation (MJO) has to do with large areas of rising and sinking air due to large areas of thunderstorms in the Indian and Pacific oceans.
Another climate signal with a big name that we shorten down to a few letters, the Madden-Julian Oscillation (MJO for short) is essentially a huge, slow-moving wave of clouds and rainfall that travels along and near the Earth’s equator, specifically across the Indian and Pacific Oceans. This batch of storms always moves from west to east and typically completes a full cycle every one to two months, though it can vary in intensity.
It is not the fact that there are storms, though that is important, but rather the extremely large area of rising and sinking air that is associated with them. Like large ripples propagating outward from a stone thrown into a calm pond. So large are these atmospheric ripples, in fact, that they can have a major impact on the weather patterns globally, including us here in the United States. In the absence of a stronger ENSO signal, meaning a stronger El Niño or La Niña, the MJO can play a more significant role in our weather patterns here during the winter.
The issue with the MJO and the seasonal outlook is that the MJO is not consistent. While it always moves from west to east, it does not always go through its progressions (classified as ‘phases’) at a consistent strength, speed, or intensity. As such, it is hard to predict a season in advance. It can give you a solid lead time of a few weeks to suggest an upcoming pattern, but I cannot look at January for example and say that we will be in a phase of the MJO that could enhance the cold or strengthen the warmth around here in that month. Just know it is a feature we keep a close eye on throughout the winter that can have major impacts on the upcoming winter season.
Model Outlook: American & European Model Solutions
The Climate Forecast System (CFS) upper-level pattern forecast for the upcoming winter favors a mild winter overall.
The two biggest weather models that we look at for the winter ahead are the American model-based Climate Forecast System (CFS) and the European Centre for Medium-Range Weather Forecasts Monthly Forecast (ECMWF Monthlies). Both models have shown reasonable agreement that temperatures when the winter is said and done are likely to finish above average.
Our concern with these monthly outlooks is twofold. First, they take heavy influence from the current state of ENSO, that is, the fact that we are currently experiencing weak La Niña conditions. We feel that the models may be weighing this too heavily for the winter ahead. Secondly, they typically perform quite poorly at catching the scope of some of the colder outbreaks that may come our way.
For example, back in the winter of 2022, we finished the month of December a little over 1°F colder than average. That doesn’t seem so bad, right? However, that December also featured D.C.’s coldest Christmas Eve on record, including the most recent time that D.C. saw single-digit low temperatures. Seasonal models can give you a hint at the winter flavor, but they typically do not show you some of the details that winter will be remembered for.
Winters in D.C. tend to be remembered for their “bursts” of winter as opposed to a sustained winter pattern. Those types of winters are quite rare here.
The latest long-range European models have been shifting to show a colder pattern setting up across the eastern half of the United States during the month of December.
More recently, some of the longer-range guidance from the ECMWF has been strongly hinting that the pattern could feature bursts of some stronger winter cold as early as December. Shown above, the latest “weeklies” have been hinting at stronger arctic blocking during the early winter months, suggesting that we may have to deal with winter weather around our region earlier than we typically do.
Total snowfall for the 2024-25 winter in the mid-Atlantic and Northeast regions.
I like to be as transparent as possible with these winter outlooks, some years are certainly more “on the mark” than others. Last year was a tricky one, with La Niña really failing to have any major climate-driving impact as it stayed weaker than expected – what some call a La Nada: flavors of La Niña but not an overall La Niña pattern.
What did we do well? The main theme of the winter was for periods of strong cold, but it would not be a theme throughout the winter. All three airports in our region saw about average to slightly above normal temperatures in December, colder than normal temperatures in January, and above normal temperatures in February.
We also forecasted a drier than normal winter, which was true for all area airports. The almost surprise of winter was that despite the drier than normal pattern prevailing, we did manage to get slightly above normal snowfall, picking up 14.9″ of snow. This was above our expectations and broke a streak of five winters in a row with below normal snowfall. We were, however, correct that a blizzard was not favored and did not occur last winter.
DMV Winter 2025-2026 Outlook: Above-average snowfall possible, with snowiest stretch in January
The Source: Information in this article comes from the FOX 5 Weather Team and the National Weather Service.
WeatherNewsWashington, D.C.MarylandVirginiaTop Stories