Could You Be Missing Accenture Stock’s Upside?

Why Accenture Is Worth A Look As Value Stock
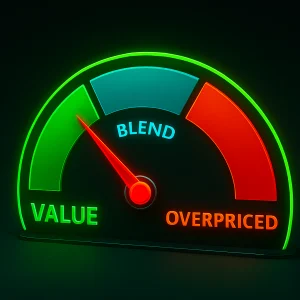
Here is why we think Accenture (ACN) stock deserves consideration as a value stock. It is currently trading nearly 37% below its 1 year high, and also trading at a PS multiple which is below the average for the last 3 years. However, it is growing, even though modestly, and has strong margins to go with its low valuation.
Accenture is riding a powerful wave in enterprise AI, evidenced by tripling generative AI revenue to $2.7 billion in fiscal year 2025, with bookings nearing $5.9 billion. This strategic focus, backed by a $3 billion multi-year investment, positions it to capture surging demand as the global IT consulting market expands by an estimated 7% in 2025 to $5.61 trillion. Recent Q4 2025 revenue growth of 7.3% to $17.6 billion underscores its capability to deliver on pervasive digital transformation initiatives, particularly in financial services (up 15%) and products (up 9%).
Let’s talk numbers
Revenue Growth: 7.4% LTM and 4.2% last 3 year average. Low growth, but this is a margin and value play.Strong Margin: Nearly 14.4% 3-year average operating margin.No Major Margin Shocks: Accenture has avoided any large large margin collapse in the last 12 months.Modest Valuation: Despite encouraging fundamentals, ACN stock trades at a PE multiple of 19.9
As a quick background, Accenture provides strategy, consulting, technology, and operations services, including application modernization, agile transformation, AI, data management, intelligent automation, and talent and organizational consulting.
ACN stock may swing. A balanced asset allocation doesn’t. Trefis’ Boston-based, wealth management partner blends strategy and discipline to smooth out market noise.
ACNS&P MedianSectorInformation Technology-IndustryIT Consulting & Other Services-PE Ratio19.923.6 LTM* Revenue Growth7.4%6.0%3Y Average Annual Revenue Growth4.2%5.5%LTM Operating Margin Change-0.1%0.2% LTM* Operating Margin14.7%18.8%3Y Average Operating Margin14.4%18.2%LTM* Free Cash Flow Margin15.6%13.6%
But do these numbers tell the full story? Read Buy or Sell ACN Stock to see if Accenture still has an edge that holds up under the hood.
What’s The Evidence That This Can Work?
Data On Strategy Viability
Below are statistics for stocks with same selection strategy applied between 12/31/2016 and 6/30/2025.
Average 6-month and 12-month forward returns of 12.7% and 25.8% respectively
Win rate (percentage of picks returning positive) of > 70% for both 6-month and 12-month periods
Strategy consistent across market cycles.
There is no guarantee that the market will always reward such value stocks, but they are certainly worth exploring.
Investing in a single stock always carries significant risk. Trefis High Quality Portfolio is designed to reduce that risk, while maximizing the upside exposure.
What’s The Stock-Specific Risk?
Associated Risk
The table below shows how deep Accenture can fall during market crises.
ACNS&P 500 2022 Inflation Shock % Change from Pre-Recession Peak -41%-25%# of Months for Full Recovery Yet to Recover15 2020 Covid Pandemic % Change from Pre-Recession Peak -33%-34%# of Months for Full Recovery 35 2018 Correction % Change from Pre-Recession Peak -23%-20%# of Months for Full Recovery 34 2008 Global Financial Crisis % Change from Pre-Recession Peak -39%-57%# of Months for Full Recovery 1249 2000 Dot-Com Bubble % Change from Pre-Recession Peak -60%-37%# of Months for Full Recovery 669
But the risk is not limited to major market crashes. Stocks fall even when markets are good – think events like earnings, business updates, outlook changes. Read ACN Dip Buyer Analyses to see how the stock has recovered from sharp dips in the past.
More from Trefis
Accenture Insights
Accenture counter-intuitive comparisonAccenture peer comparisonComplete analyses on Accenture (ACN) stockLatest analyses on all stocksComparison of Bear Markets of the S&P500
Invest in Market-Beating Trefis Portfolios
Invest in Trefis Strategies
The Trefis High Quality (HQ) Portfolio, with a collection of 30 stocks, has a track record of comfortably outperforming its benchmark that includes all 3 – the S&P 500, S&P mid-cap, and Russell 2000 indices. Why is that? As a group, HQ Portfolio stocks provided better returns with less risk versus the benchmark index; less of a roller-coaster ride, as evident in HQ Portfolio performance metrics.


