Good morning! I hope everyone is doing well and isn’t too bummed out about New York’s two-game skid. Like I said after the Bucks game, it’s a long season. There will be ups and downs. Deep breaths all the way.
Today’s question comes to us from Drew G, who is sticking with the weekly theme:
You often reference arcane statistics that shed light on situations. Here is a question that begs for such light:
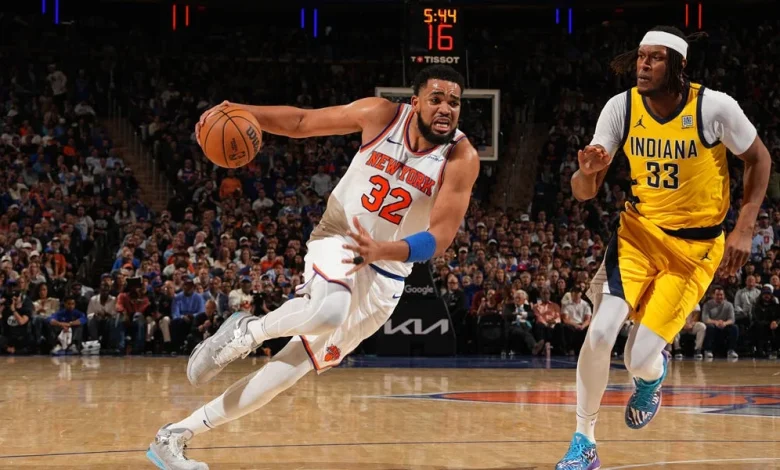
When KAT starts from the top of the key and dribbles hard into the paint, what are the results? It seems from the naked eye that they are poor.
Thanks for the question Drew, although it did prompt me to go back and rewatch every single Karl-Anthony Towns 2-point attempt from the 2025 postseason (yes, all 211 of them). While I usually love going back and watching film, I can’t say I was particularly thrilled with this decision. I’ll take an IOU on those two hours of my life, thanks.
Before we get to the film though, let’s take a look at the data so we can start sketching out an answer to your question.
I’ll note up front that the NBA’s driving statistics don’t allow us to tell where a player’s drive originated from, nor can we tell how far they made it before the drive terminated. That said, last season Karl-Anthony Towns drove it 8.0 times per game, shot 4.9 field goals per game out of drives, converted these shots at a 52.7 percent clip, generated 2.5 free throws per game on drives, passed it 11.8 percent of the time, dished an assist 4.2 percent of the time, and turned it over 7.5 percent of the time.
For context, while he was only the 85th most frequent driver in the NBA, his average shots on drives ranked 43rd, which hammers home just how infrequent it is for him to pass it once he starts moving. More on this in a bit. As far his his FG%, free throw rate and turnover rate, all those numbers are middle of the pack among frequent drivers. In other words, the numbers said that last year, his driving game was nothing special but also not bad. It was just…fine.
(By comparison, Jalen Brunson, who drove more frequently last season than anyone besides SGA, shot 55.1 percent, took 2.8 free throws, passed 40.4 percent of the time, assisted 10.2 percent of the time, and turned it over 4.4 percent of the time. By any metric, he is one of the NBA’s elite drivers of the basketball.)
In the playoffs, KAT’s drove it a bit less frequently but the numbers were more or less the same, although I will point out one bit of high comedy, which is that on 126 postseason drives, Towns handed out the same number of assists as you and me. I’ll take my $53 million now, thanks.
This brings us to the biggest issue with Towns’ driving game last season: it was more predetermined than tomorrow’s sunrise.
Watch below, for instance, what happens on a drive from last season’s first round: