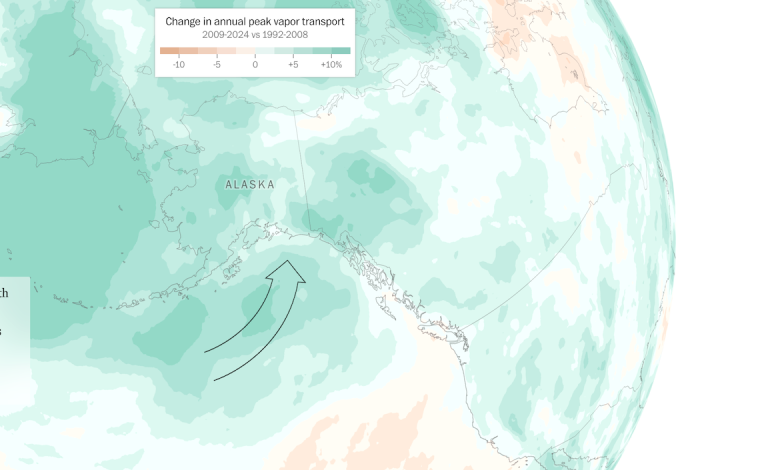
The Washington Post has created a visualization showing how the amount of water vapor moving through Earth’s atmosphere has changed between 1992–2008 and 2009–2024. These flows transport vast quantities of moisture from oceans to land, and their intensity determines how much water the atmosphere carries and where it eventually falls as rain. Using data from the European Centre for Medium-Range Weather Forecasts, the visualization shows that atmospheric moisture flows have increased across most of the globe as warmer oceans release more vapor into the air. This helps explain why storms are producing heavier rainfall and floods are becoming more frequent and destructive.
Take a look.