(updated to include the game against San Jose)
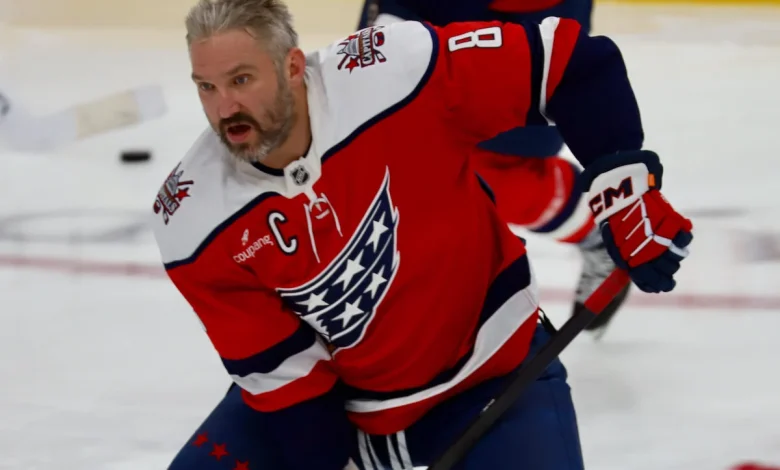
With 911 regular season goals in what is likely the last season of his NHL career, Capitals captain Alex Ovechkin is undoubtedly the best goal-scorer in NHL history. While the what-if scenarios certainly landed in his favor throughout his career, which got him to the top of the NHL’s goal-scoring leaderboard, some events kept him from scoring 1,000 goals, a number that would have put him at least 106 goals ahead of Wayne Gretzky’s now second place number, 894.
Three events in his career cost Ovi around 44 goals, including 22 during the 2012-2013 lockout, nine during the Covid-shortened 2019-2020 season (he won the Rocket Richard in both of these seasons, anyway), and 13 in the Covid-shortened 2020-2021 season (not counting the games he missed with injuries and violating Covid protocol).
Ovi has only missed 76 games in his career due to injuries, suspensions and other reasons. Those add up to about 45 goals he was on pace to score those seasons. Last year hurt the most, when a leg injury kept him from scoring 11 extra goals, based on his pace at the time.
Had Ovi never missed a game, and the lockout and Covid-shortened seasons never happened, he’d be at about 1,025 goals by now. That’s not counting the 2004-2005 lockout season, when a 19-year-old Ovi hypothetically could have scored 40-50 more goals, but that guess is based on the 52 he scored a year later.
While Ovi was never destined to play every game (Russian Machine Sometimes Breaks?), the lockouts and Covid-shortened seasons stung the most, especially as he was scoring at rapid paces those years. Eliminating the 2004-2005 lockout season, the 44 goals, plus 27 more he’s on pace to score this year, would put him at 980 at the end of this season.
Coaching decisions prevented some Ovi goals. This most notably happened in 2016-2017, when Barry Trotz cut Ovi’s ice time by nearly two minutes a game, limiting him to 33 goals and costing him about 17 goals. (Note: Though Ovi averaged his fewest minutes per game last year, Spencer Carbery made the most of that time, as he scored 44 goals.) Also, Ovi’s minutes in 2016-2017 were cut in an effort to ‘rest’ him for the playoffs, and because the Caps were so good that season – winning their second President’s Trophy in a row – they didn’t need any more goals out of him.
One other time did coaching decisions and system changes cost him goals, as he slumped during the 2012-2013 season – scoring only 38 times with 65 points – under Dale Hunter’s ‘trap’ defense. But that was actually an improvement over his 32 in the 2010-11 season under then head coach Bruce Boudreau, though his 53 assists kept him above a point-a-game pace.
Another coaching decision likely cost him several goals that would make some folks groan: Ovi’s empty-net goal totals could have been much higher. In the last five seasons (current season included), he has averaged .09 empties a game, up from .03 in his first 16 seasons. Had he scored empty net goals in his first 16 seasons at the same rate that he’s scoring them now, he would have 69 extra goals.
Only once in his career did Ovi truly slump where it’s hard to pinpoint an excuse. That came in the 2023-2024 season, when he only scored eight goals in his first 43 games, before exploding for 23 in his final 36 games. Fortunately, he got past that, otherwise he’d still be chasing the record.
While it’s unlikely Ovi will get to 1,000 goals, without signing a multi-year extension and continuing to score at his career-average pace, it’s interesting to think that a few what-ifs in his career could have put him much closer.
The final column here is the number of goals Ovi missed out on scoring had he maintained his same pace in 82 games.
Season
Games
Goals
Assists
Points
Projected Goals
Missing Goals
2005-2006
81
52
54
106
52.64
0.64
2006-2007
82
46
46
92
46
0
2007-2008
82
65
47
112
65
0
2008-2009
79
56
54
110
58.13
2.13
2009-2010
72
50
59
109
56.94
6.94
2010-2011
79
32
53
85
33.22
1.22
2011-2012
78
38
27
65
39.95
1.95
2012-2013
48
32
24
56
54.67
22.67
2013-2014
78
51
28
79
53.62
2.62
2014-2015
81
53
28
81
53.65
0.65
2015-2016
79
50
21
71
51.9
1.9
2016-2017
82
33
36
69
33
0
2017-2018
82
49
38
87
49
0
2018-2019
81
51
38
89
51.63
0.63
2019-2020
68
48
19
67
57.88
9.88
2020-2021
45
24
18
42
43.73
19.73
2021-2022
77
50
40
90
53.25
3.25
2022-2023
73
42
33
75
47.18
5.18
2023-2024
79
31
34
65
32.18
1.18
2024-2025
65
44
29
73
55.51
11.51
2025-2026
28
14
15
29
41
27