The annual realestate.com.au Hot 100 has revealed the suburbs across Australia expected to outperform in 2026 and beyond.
They’re suburbs undergoing change through gentrification, rezoning or a demographic shift; already-hot markets with a serious supply-demand imbalance; or a former hotspot that’s since cooled and is now on the cusp of a turnaround.
Compiled by a panel of industry experts, the 100 suburbs in this year’s list were selected based on several growth drivers that should not only support home values in the year ahead but see prices outperform against the broader market.
Use the interactive map below to see which suburbs made the Hot 100.
Two thirds of the list is made up of capital city suburbs, and one third regional locations. The cheapest suburb on the list has a median house price below $400,000, and several suburbs offer a gross rental yield of more than 7%.
Jump ahead to see the state-by-state breakdown of the 2026 Hot 100
2026 trends: Rezoning, Olympics and the turnaround story
Commenting on the list, REA Group senior economist Eleanor Creagh said many suburbs are located within an emerging growth corridor with home prices set to benefit from major infrastructure projects such as a new airport, metro line or stadium.
“Generally, price growth and investor interest tend to concentrate where new employment, upgraded transport, and new home delivery with anticipated population growth are intersecting,” Ms Creagh said.
An Olympics-driven infrastructure boom across parts of Queensland is tipped to increase demand in certain suburbs. Picture: Getty
“Western Sydney features heavily particularly around the new airport and associated infrastructure corridor with new metro and rail connections,” she said.
“Queensland’s entries are split between inner Brisbane gentrification and the broader southeast Queensland growth story with relatively affordable housing, strong jobs growth and transport hubs and Olympic-tied infrastructure underpinning demand from owner-occupier buyers and investors.”
Darwin – which has more suburbs on this year’s list than the previous three years combined – has emerged as the standout capital city after a decade of underperformance, only behind Perth in terms of capital city price growth over the past 12 months.
Property prices have been heating up in Darwin, with further growth tipped in the year ahead. Picture: realestate.com.au
Outside of the capital cities, affordability emerges as a key theme – though these regional hotspots aren’t one-industry towns.
“The regional picks tend to centre on larger regional hubs with more diversified economies supported by health, education, agriculture, logistics, and tourism,” Ms Creagh said.
Jump ahead to see the 2026 Hot 100
National home prices have risen for 11 consecutive months according to PropTrack, as falling interest rates boosted borrowing capacity and buyer sentiment. Investors have become increasingly active, while expanded government support has boosted first-home buyer activity.
But Ms Creagh said below the national headline, the pattern of growth is shifting.
“Over the past year, Darwin, Hobart, Melbourne and Sydney have seen the fastest acceleration in annual gains, as previously softer markets regain momentum,” Ms Creagh said.
“Meanwhile, Brisbane, Adelaide and Perth continue to record strong price rises, but growth is no longer accelerating relative to this time last year.”
Custom Call to Action
Research any property
Get all the property intel you need.
Search now
Rising inflation has seen many economists scrap projections for another rate cut next year, with a growing number forecasting the next move by the RBA could be up rather than down.
“With interest rates now expected to remain on hold for an extended period, affordability constraints are likely to see price growth moderate throughout 2026,” Ms Creagh added.
Identifying the next hot suburb
The list was compiled by a panel of industry experts – including the heads of national real estate agencies, buyer’s agents, researchers, investors and an academic – and complemented by PropTrack data and economic analysis.
Suburbs in the Hot 100 were nominated based on the following growth drivers:
- Affordability, either low prices suiting buyers on a budget or relative affordability compared to nearby suburbs
- Amenity, being the level of lifestyle pluses, from bars and restaurants to boutiques and parklands
- Family appeal, such as dwelling type, perceived safety and proximity to good schools
- Location, including proximity to the CBD or major hubs, or closeness to natural amenity like beaches
- Investment prospects, from rental market conditions to expected imminent upside
- Gentrification, being the changing face of a suburb
- Population growth, representing a projected increase in the number of locals
- Demographic change, indicating a shift from the current make-up of residents, for example young families replacing downsizing elderly locals
- Infrastructure, looking at major investments in projects that will benefit the suburb or surrounds.
The Hot 100 for 2026
Jump to your state or territory
In suburbs where there has not been enough sales or rental activity over the past 12 months to give an accurate price indication, PropTrack data will reflect N/A in the tables below.
Jump back to the top
New South Wales
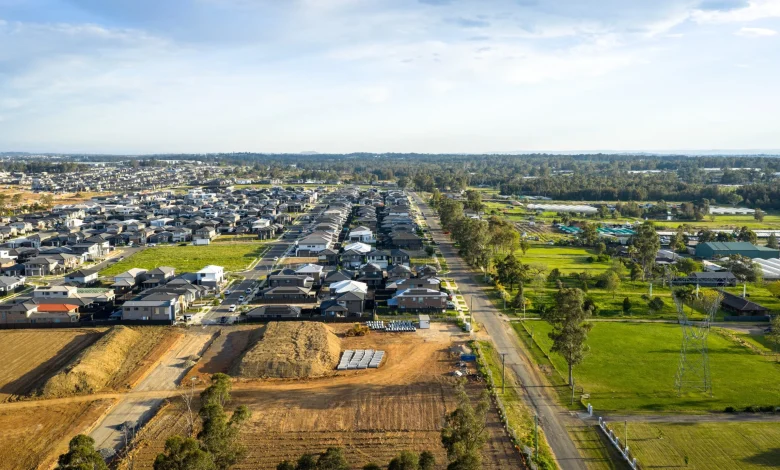
One quarter of this year’s Hot 100 list was located in NSW, with many picks centred around the state government’s rezoning frenzy and the soon-to-open Western Sydney Airport.
Austral
Population Distance to capital Main demographic 6,847 37km 30-34 years
Nominated by: Matt Lahood
Nominated for: Population growth
Once full of acreage-style properties, the suburb of Austral in southwest Sydney has rapidly changed over the past decade.
Rezoned as part of the NSW Government’s South West Growth Area planning in 2013 – along with the neighbouring Leppington North precinct – the development suburb will have more than 17,000 homes once complete, with an estimated 55,000 new residents.
To put that growth into context, just 3,000 people lived in Austral during the 2016 Census, which jumped to almost 7,000 in 2021.
Austral is set for a population boom. Picture: Getty
Not only will this continued population growth bode well for property prices, but The Agency’s Matt Lahood also notes the suburb’s proximity to the new 24/7 Western Sydney airport – without being under the flight path.
House prices in Austral are up a sharp 13% in the past 12 months, and while the median house price is down compared to 10 years ago, that’s due to a compositional change in the suburb, with large acreages being replaced by many smaller blocks.
Due to the suburb being dominated by freestanding homes, there isn’t enough data to include units in the tables below.
Source: PropTrack | Median price – rolling 12 months ending Nov 2025. Supply – YoY change in listings. Demand – YoY change in number of key enquiries per listing. N/A – not enough data for accurate reading. Buy Median price Annual change Supply Demand House $1,018,000 13% 33% 15% Unit N/A N/A N/A N/A Source: PropTrack | 10 yr price growth – change in price over past year compared to 2015. Rent – weekly median price. Vacancy rate – percentage of available rentals (filter: minimum 5 vacant properties in suburb). Gross rental yield – median percentage of a property’s value received as rental income. Invest 10 year price growth Rent Change Vacancy rate Gross yield House -63% $770 3% 4.0% 3.8% Unit N/A N/A N/A N/A 4.7%
Bateau Bay
Population Distance to capital Main demographic 12,516 59km 5-9 years
Nominated by: Matt Sharp
Nominated for: Amenity, family appeal, demographic change
Buyers seeking a coastal lifestyle with long-term upside should look to Bateau Bay on the NSW central coast, according to REBAA regional representative Matt Sharp.
House prices have roughly doubled in the past decade, and with limited supply of newer homes, he expects the suburb’s strong lifestyle pull and high buyer interest will continue to support price growth.
“Gentrification is well underway, with more Sydney buyers and young families moving in, and limited new supply supporting property values,” Mr Sharp said.
“The suburb offers easy access to schooling, green spaces, and coastal recreation – all strong draws for families.”
Residents have easy access to lifestyle amenities such as beaches, parklands and cafes, and the town has a major shopping centre, Bay Village.
Source: PropTrack | Median price – rolling 12 months ending Nov 2025. Supply – YoY change in listings. Demand – YoY change in number of key enquiries per listing. N/A – not enough data for accurate reading. Buy Median price Annual change Supply Demand House $1,170,000 4% -3% -4% Unit N/A N/A N/A N/A Source: PropTrack | 10 yr price growth – change in price over past year compared to 2015. Rent – weekly median price. Vacancy rate – percentage of available rentals (filter: minimum 5 vacant properties in suburb). Gross rental yield – median percentage of a property’s value received as rental income. Invest 10 year price growth Rent Change Vacancy rate Gross yield House 109% $690 19% N/A 3.5% Unit N/A $530 15% N/A 4.6%
Bathurst
Population Distance to capital Main demographic 7,001 160km 25-29 years
Nominated by Simon Pressley
Nominated for: Affordability
It’s famous for its motor racetrack on Mount Panorama, but the regional city of Bathurst has plenty more to offer.
For one, it’s extremely pretty with an abundance of elegant architectural buildings throughout the city centre – reflective of its prosperity during the gold rush era.
Bathurst in regional NSW has a diverse economy and young population. Picture: realestate.com.au
It’s also a hub for education with a large university campus and several private schools, and has a relatively young population with a quarter of its residents aged from 20-34 years, according to the latest Census.
Propertyology’s Simon Pressley said Bathurst offers a diverse economy and relatively affordable housing.
“I anticipate the momentum created from a 7% increase in buyer activity over the last 12 months to continue through to 2026,” Mr Pressley said.
While the city of Bathurst has a population of 7,000, the greater region is home to more than 40,000 people. Orange – a city famous for its food and wine – is just 45 minutes inland.
Source: PropTrack | Median price – rolling 12 months ending Nov 2025. Supply – YoY change in listings. Demand – YoY change in number of key enquiries per listing. Buy Median price Annual change Supply Demand House $660,000 3% -1% 36% Unit $458,000 -4% 6% 108% Source: PropTrack | 10 yr price growth – change in price over past year compared to 2015. Rent – weekly median price. Vacancy rate – percentage of available rentals (filter: minimum 5 vacant properties in suburb). Gross rental yield – median percentage of a property’s value received as rental income. Invest 10 year price growth Rent Change Vacancy rate Gross yield House 90% $500 6% 1.3% 4.5% Unit 66% $400 3% 0.8% 4.7%
Boambee East
Population Distance to capital Main demographic 5,304 430km 55-59 years
Nominated by: Mathew Tiller
Nominated for: Location
Located near Coffs Harbour on the NSW mid north coast, Boambee East is attracting city buyers seeking a laid-back coastal lifestyle – without the Byron Bay price tag.
Like many coastal towns, Boambee East saw home prices skyrocket during the pandemic though growth has stabilised in the past couple of years.
But according to LJ Hooker’s Mathew Tiller, lean housing stock means good properties tend to move quickly.
“Strong regional migration into the mid north coast is keeping pressure on prices and rents,” he said.
“Families like the school access, green space and proximity to jobs, health and the airport.”
Source: PropTrack | Median price – rolling 12 months ending Nov 2025. Supply – YoY change in listings. Demand – YoY change in number of key enquiries per listing. Buy Median price Annual change Supply Demand House $793,000 6% -9% 45% Unit $590,000 1% -29% 56% Source: PropTrack | 10 yr price growth – change in price over past year compared to 2015. Rent – weekly median price. Vacancy rate – percentage of available rentals (filter: minimum 5 vacant properties in suburb). Gross rental yield – median percentage of a property’s value received as rental income. Invest 10 year price growth Rent Change Vacancy rate Gross yield House 96% $660 -3% N/A 4.4% Unit 101% $550 4% N/A 4.8%
Box Hill
Population Distance to capital Main demographic 6,450 38km 20-24 years
Nominated by: Belinda Connor
Nominated for: Investment prospects, infrastructure, family appeal
Located in Sydney’s rapidly expanding northwest, Box Hill is one of Sydney’s fastest growing areas.
The area was rezoned in 2013 as part of the state government’s North West Priority Growth Area, and will be home to almost 50,000 residents by completion. In the 2016 Census, Box Hill’s population was just 902.
“Box Hill is a great choice for property investors and residents alike, offering strong capital growth, high rental yields, and major infrastructure developments that promise long-term value,” said Elders general manager of property, Belinda Connor.
“It’s also a great place to live, with family-friendly communities, green spaces, excellent transport links, and growing lifestyle amenities.”
House prices have risen 10% in the past 12 months to a median $1.297m. The 10-year decline is due to compositional changes in the suburb, with large acreages now replaced with smaller blocks of land in new developments.
Source: PropTrack | Median price – rolling 12 months ending Nov 2025. Supply – YoY change in listings. Demand – YoY change in number of key enquiries per listing. N/A – not enough data for accurate reading. Buy Median price Annual change Supply Demand House $1,297,000 10% 26% 6% Unit N/A N/A 64% 2% Source: PropTrack | 10 yr price growth – change in price over past year compared to 2015. Rent – weekly median price. Vacancy rate – percentage of available rentals (filter: minimum 5 vacant properties in suburb). Gross rental yield – median percentage of a property’s value received as rental income. Invest 10 year price growth Rent Change Vacancy rate Gross yield House -57% $800 3% 3.8% 3.5% Unit N/A N/A N/A N/A 4.8%
Broadmeadow
Population Distance to capital Main demographic 1,688 116km 25-29 years
Nominated by: Linda Johnson
Nominated for: Infrastructure, location, gentrification, affordability, investment prospects
Inner-Newcastle living without the east end price tag – that’s what’s in store for Broadmeadow, a suburb that’s recently been rezoned by the NSW government, enabling up to 3,200 new homes to be built on state-owned land and supporting more than 2,000 new construction jobs.
“This is the largest urban renewal in Greater Newcastle,” REBAA NSW state representative Linda Johnson said.
“Amenity is already in place with the 313-hectare precinct already hosting McDonald Jones Stadium, the Entertainment Centre and the Showground, with Broadmeadow Station within easy walk, therefore the lifestyle and transport grid are preexisting, not speculative.”
The median house price in Broadmeadow is around half that of its premium beachside neighbours.
“Broadmeadow suits transit-oriented owner occupiers such as professionals and young families who value easy CBD access but without the beachside price tag, also downsizers wanting flat, walkable amenity, as well as investors chasing rentability near jobs and venues,” she said.
Source: PropTrack | Median price – rolling 12 months ending Nov 2025. Supply – YoY change in listings. Demand – YoY change in number of key enquiries per listing. Buy Median price Annual change Supply Demand House $983,000 -1% 8% 31% Unit $750,000 5% 10% -16% Source: PropTrack | 10 yr price growth – change in price over past year compared to 2015. Rent – weekly median price. Vacancy rate – percentage of available rentals (filter: minimum 5 vacant properties in suburb). Gross rental yield – median percentage of a property’s value received as rental income. N/A – not enough data for accurate reading. Invest 10 year price growth Rent Change Vacancy rate Gross yield House 93% $693 3% N/A 3.3% Unit 74% $600 3% N/A 3.8%
Calderwood
Population Distance to capital Main demographic 3,013 88km 30-34 years
Nominated by: Mathew Tiller
Nominated for: Location, family appeal, affordability
New housing development suburb Calderwood on the NSW South Coast offers a laid-back lifestyle close to beaches, shops and restaurants, but at a lower price point than its coastal neighbours.
Calderwood offers more affordable homes compared to nearby beachside suburbs like Shellharbour and Kiama. Picture: realestate.com.au
Conveniently positioned just moments to Albion Park’s village centre and with easy access to the Princes Highway, the master planned suburb is quiet but well connected to Wollongong and Shellharbour, while the Macquarie Pass to its west is the gateway to the Southern Highlands.
“It’s become a go‑to for young families priced out of the coast but still wanting beaches, schools and daily amenity,” said LJ Hooker’s Mathew Tiller.
“The pipeline of local services is catching up quickly with the population. As Sydney buyers keep looking further south for value, Calderwood stays in play.”
Source: PropTrack | Median price – rolling 12 months ending Nov 2025. Supply – YoY change in listings. Demand – YoY change in number of key enquiries per listing. N/A – not enough data for accurate reading. Buy Median price Annual change Supply Demand House $990,000 6% -8% 68% Unit N/A N/A N/A N/A Source: PropTrack | 10 yr price growth – change in price over past year compared to 2015. Rent – weekly median price. Vacancy rate – percentage of available rentals (filter: minimum 5 vacant properties in suburb). Gross rental yield – median percentage of a property’s value received as rental income. Invest 10 year price growth Rent Change Vacancy rate Gross yield House 319% $800 3% 4.0% Unit N/A N/A N/A N/A 3.5%
Charlestown
Population Distance to capital Main demographic 13,601 110km 35-39 years
Nominated by: Linda Johnson
Nominated for: Amenity, infrastructure, family appeal, population growth, investment prospects
Home to the Hunter region’s largest shopping mall and just 10km southwest of Newcastle’s CBD, Charlestown is strategically placed for growth.
Sitting between the coastline and Lake Macquarie, REBAA NSW state representative Linda Johnson said Charlestown functions as the region’s commercial and retail hub.
“Population is projected to exceed 250,000 by 2041, requiring 13,500+ new homes by 2036,” Ms Johnson said.
“Council is enabling this with expanded R3 zones, greater height limits and reduced minimum lot sizes in targeted areas.”
Amenity is broad with families and upgraders seeking the beaches, lakefront recreation and strong schooling, while a $120m private hospital expansion and development projects in Trinity Point and Glendale will support jobs.
“Charlestown attracts investors who are targeting stable tenant demand with practical links to Newcastle CBD and the wider Hunter.”
Source: PropTrack | Median price – rolling 12 months ending Nov 2025. Supply – YoY change in listings. Demand – YoY change in number of key enquiries per listing. Buy Median price Annual change Supply Demand House $985,000 8% -8% 18% Unit $690,000 8% -1% 25% Source: PropTrack | 10 yr price growth – change in price over past year compared to 2015. Rent – weekly median price. Vacancy rate – percentage of available rentals (filter: minimum 5 vacant properties in suburb). Gross rental yield – median percentage of a property’s value received as rental income. N/A – not enough data for accurate reading. Invest 10 year price growth Rent Change Vacancy rate Gross yield House 95% $690 6% 0.7% 3.7% Unit 82% $575 8% N/A 4.5%
Dubbo
Population Distance to capital Main demographic 43,516 302km 25-29 years
Nominated by: Belinda Connor
Nominated for: Affordability, amenity, population growth
With a median house price of $610,000, Dubbo offers affordability without sacrificing on lifestyle.
Dubbo’s median house price has doubled in the past decade, though homes remain affordable. Picture: Getty
Located in the heart of NSW, Dubbo acts as the major service centre for the broader Orana region of more than 200,000 people.
“Dubbo is a thriving regional city offering a great balance between lifestyle and opportunity,” Belinda Connor said.
Ms Connor said the city offers strong job opportunities across healthcare, education, retail and agriculture, and is well connected by road, rail and air to Sydney and other regions.
And of course, it’s home to the famous Taronga Western Plains Zoo.
Source: PropTrack | Median price – rolling 12 months ending Nov 2025. Supply – YoY change in listings. Demand – YoY change in number of key enquiries per listing. Buy Median price Annual change Supply Demand House $615,000 7% -2% 104% Unit $351,000 -1% -26% 48% Source: PropTrack | 10 yr price growth – change in price over past year compared to 2015. Rent – weekly median price. Vacancy rate – percentage of available rentals (filter: minimum 5 vacant properties in suburb). Gross rental yield – median percentage of a property’s value received as rental income. Invest 10 year price growth Rent Change Vacancy rate Gross yield House 87% $520 4% 0.8% 4.6% Unit 38% $358 2% 1.0% N/A
Earlwood
Population Distance to capital Main demographic 18,053 10km 45-49 years
Nominated by: Veronica Morgan
Nominated for: Demographic change, gentrification, family appeal
You’ve probably heard of Marrickville – an inner west Sydney suburb regularly ranked among Australia’s coolest neighbourhoods.
But just one suburb south, on the other side of the Cooks River, lies Earlwood – offering larger blocks, less noise (it’s not under the flight path like Marrickville) and lots of green space.
Buyer’s agent Veronica Morgan said Earlwood is transitioning as long-established migrant families – predominantly Greek – sell to a new wave of buyers.
“Earlwood attracts tradies and young Aussie families seeking larger homes near the inner west,” Ms Morgan said.
“These shifts are breathing new energy – and capital-growth potential – into long-time sleeper suburbs.”
Source: PropTrack | Median price – rolling 12 months ending Nov 2025. Supply – YoY change in listings. Demand – YoY change in number of key enquiries per listing. Buy Median price Annual change Supply Demand House $2,050,000 -6% -4% 3% Unit $835,000 -7% -3% 3% Source: PropTrack | 10 yr price growth – change in price over past year compared to 2015. Rent – weekly median price. Vacancy rate – percentage of available rentals (filter: minimum 5 vacant properties in suburb). Gross rental yield – median percentage of a property’s value received as rental income. N/A – not enough data for accurate reading. Invest 10 year price growth Rent Change Vacancy rate Gross yield House 59% $900 -8% 1.3% 2.3% Unit 16% $690 6% N/A 4.4%
Five Dock
Population Distance to capital Main demographic 9,823 7km 35-39 years
Nominated by: Veronica Morgan
Nominated for: Infrastructure, investment prospects, family appeal
Five Dock sits in a convenient pocket less than 10km west of the CBD with good connectivity by road to the city centre, as well as Sydney’s western and northern suburbs.
The clinker? Peak hour traffic can make the morning commute painful. But major infrastructure and development projects are set to change the game for the relatively quiet neighbourhood.
“The upcoming Five Dock metro station – part of the Western Sydney Airport line – will dramatically improve accessibility, fuelling buyer interest and long-term growth,” Veronica Morgan said.
The upcoming metro station will slice commuting times down dramatically. Picture: realestate.com.au
The metro station is expected to open in 2032 – which will cut travel time to the CBD down to just eight minutes (currently 45 minutes by car in peak hour).
Full of period homes on big blocks along the Bay Run pedestrian and cycling track, Ms Morgan said the balance of heritage charm and infrastructure investment makes it a “standout choice” for upgraders.
Source: PropTrack | Median price – rolling 12 months ending Nov 2025. Supply – YoY change in listings. Demand – YoY change in number of key enquiries per listing. Buy Median price Annual change Supply Demand House $2,826,000 7% -9% -8% Unit $1,148,000 2% 2% -15% Source: PropTrack | 10 yr price growth – change in price over past year compared to 2015. Rent – weekly median price. Vacancy rate – percentage of available rentals (filter: minimum 5 vacant properties in suburb). Gross rental yield – median percentage of a property’s value received as rental income. Invest 10 year price growth Rent Change Vacancy rate Gross yield House 87% $1,100 10% 1.5% 2.2% Unit 41% $760 0% 0.8% 3.5%
Hornsby
Population Distance to capital Main demographic 22,46221km 40-44 years
Nominated by: Veronica Morgan
Nominated for: Infrastructure, population growth
The state government has embarked on a rezoning frenzy across key parts of Sydney in an attempt to boost housing supply within walking distance of metro and train stations.
Hornsby in Sydney’s northwest is one of eight so-called Transport Orientated Development (TOD) Accelerated Precincts, which will drive population growth and new infrastructure along the North Shore train line, according to Veronica Morgan.
“Expect higher-density nodes near stations and improved amenities that lift surrounding detached-home values,” she said.
“For families, the enduring drawcard remains proximity to elite schools and reliable public transport.”
Rezoning was finalised late last year and is expected to accommodate more than 6,000 new homes and close to 3,000 new jobs across the Hornsby precinct.
Source: PropTrack | Median price – rolling 12 months ending Nov 2025. Supply – YoY change in listings. Demand – YoY change in number of key enquiries per listing. Buy Median price Annual change Supply Demand House $1,850,000 4% 5% -13% Unit $725,000 2% -14% 19% Source: PropTrack | 10 yr price growth – change in price over past year compared to 2015. Rent – weekly median price. Vacancy rate – percentage of available rentals (filter: minimum 5 vacant properties in suburb). Gross rental yield – median percentage of a property’s value received as rental income. Invest 10 year price growth Rent Change Vacancy rate Gross yield House 67% $850 0% 0.9% 2.6% Unit 12% $620 3% 1.3% 4.7%
Leppington
Population Distance to capital Main demographic 9,423 41km 30-34 years
Nominated by: Mathew Tiller
Nominated for: Infrastructure, affordability
Another pick for Sydney’s booming southwest growth corridor, Leppington is fast transforming from paddocks into a community of contemporary family homes equivalent to the cost of a one- or two-bedroom apartment in the city’s inner suburbs.
And until now, its proposed town centre has been stuck in limbo.
For context, the 440ha site for Leppington’s town centre was rezoned as a business, industrial and commercial hub in 2013. Just a year later, the federal government confirmed nearby Badgerys Creek would be the location of Sydney’s new airport, with a new city – Bradfield – to become the west’s commercial and investment hub.
After years of back and forth between councils and the state government over what to do with the Leppington site, things are now moving – and quickly.
By early 2026 the NSW government is expected to finalise a rezoning of the area to allow thousands of new homes with more shopping and dining options instead of the originally planned business park. And earlier this year, the federal government pledged to secure a new rail corridor linking Leppington station to Bradfield and the new airport (no timeline on this yet).
“The area is pulling in young families who want a new‑build home and a yard but still need access to major jobs,” Mathew Tiller said, noting the suburb still offers relative affordability compared with Sydney’s inner and middle rings.
“More transport and town‑centre amenity are locked in, which supports demand into 2026.”
Source: PropTrack | Median price – rolling 12 months ending Nov 2025. Supply – YoY change in listings. Demand – YoY change in number of key enquiries per listing. Buy Median price Annual change Supply Demand House $1,083,000 0% -2% 31% Unit N/A N/A N/A N/A Source: PropTrack | 10 yr price growth – change in price over past year compared to 2015. Rent – weekly median price. Vacancy rate – percentage of available rentals (filter: minimum 5 vacant properties in suburb). Gross rental yield – median percentage of a property’s value received as rental income. N/A – not enough data for accurate reading. Invest 10 year price growth Rent Change Vacancy rate Gross yield House 50% $780 4% 2.7% 3.6% Unit N/A N/A N/A N/A 4.5%
Little Bay
Population Distance to capital Main demographic 4,817 13km 35-39 years
Nominated by: Veronica Morgan
Nominated for: Location, affordability
We all know about Bondi and Manly – but you may not have heard of Little Bay.
Framed by national park, golf courses and coastline to the south and east, and the Long Bay jail to the north (long speculated as a future redevelopment site), Little Bay offers beachside living in the affluent eastern suburbs, without the Bondi premium.
Little Bay is a hidden gem at the southern point of Sydney’s eastern suburbs. Picture: realestate.com.au
“You’re still within reach of the city and airport, with oceanfront parks, beaches and cafes aplenty,” Veronica Morgan said.
Little Bay has a median house price of $2.6m, well below Bondi Beach’s $4.6m – hey, it’s all relative, right?
Source: PropTrack | Median price – rolling 12 months ending Nov 2025. Supply – YoY change in listings. Demand – YoY change in number of key enquiries per listing. Buy Median price Annual change Supply Demand House $2,805,000 8% 29% -27% Unit $1,113,000 -18% -20% -24% Source: PropTrack | 10 yr price growth – change in price over past year compared to 2015. Rent – weekly median price. Vacancy rate – percentage of available rentals (filter: minimum 5 vacant properties in suburb). Gross rental yield – median percentage of a property’s value received as rental income. N/A – not enough data for accurate reading. Invest 10 year price growth Rent Change Vacancy rate Gross yield House 81% $1,590 -1% N/A 2.9% Unit 25% $850 -4% N/A 4.1%
Newtown
Population Distance to capital Main demographic 14,690 4km 25-29 years
Nominated by: Nerida Conisbee
Nominated for: Amenity
Newtown is the beating heart of Sydney’s inner west, known for its vibrant mix of cafes, live music venues, boutiques, and dining options. King Street, a 2km road stretching from top to tail, acts as its main artery.
That amenity is the reason Ray White’s Nerida Conisbee has nominated it in this year’s Hot 100, pointing to Neoval data which shows the median home price has jumped more than 50% since 2015.
“Close to the CBD and well-serviced by public transport, Newtown combines cultural richness with convenience,” Ms Conisbee said.
Newtown’s King Street is renowned for its vibrant dining and retail scene. Picture: realestate.com.au
Off-street parking comes at a premium, though with everything at your doorstep, Census data shows the average number of vehicles per home is less than one.
“Its character housing and energetic urban feel make it one of Sydney’s most desirable inner suburbs for those seeking both amenity and atmosphere.”
Newtown has a relatively young population with around half of its residents aged between 20 and 39 years, while the share of residents renting in Newtown is almost double the national average.
Source: PropTrack | Median price – rolling 12 months ending Nov 2025. Supply – YoY change in listings. Demand – YoY change in number of key enquiries per listing. Buy Median price Annual change Supply Demand House $1,885,000 4% -2% 3% Unit $860,000 5% 7% 5% Source: PropTrack | 10 yr price growth – change in price over past year compared to 2015. Rent – weekly median price. Vacancy rate – percentage of available rentals (filter: minimum 5 vacant properties in suburb). Gross rental yield – median percentage of a property’s value received as rental income. Invest 10 year price growth Rent Change Vacancy rate Gross yield House 54% $900 -5% 1.1% 2.8% Unit 32% $600 -3% 1.0% 4.4%
Redfern
Population Distance to capital Main demographic 13,072 2km 25-29 years
Nominated by: Veronica Morgan
Nominated for: Gentrification, amenity, investment prospects
“Once gritty, now magnetic” is how Veronica Morgan describes Redfern, an inner-city suburb on the southern border of Sydney’s CBD.
The once-low-socioeconomic suburb has rapidly transformed into a vibrant hub for students and young professionals seeking convenience – Redfern’s train station has 10 platforms connecting residents to all corners of the city and beyond.
Now in the latter stage of gentrification – much like neighbouring Surry Hills – it’s common to see Redfern’s iconic terraces restored and transformed into modern family homes.
“Its heritage terraces, warehouse conversions and inner-city convenience make it a key beneficiary of Sydney’s urban consolidation,” Ms Morgan said. “Redfern is now more ‘premium edge’ than fringe.”
The recently completed redevelopment of an old carpark and shopping complex (once called the Redfern Mall but referred to by locals as the ‘death’ or ‘murder mall’ due to its rundown state) has become home to one of Sydney’s most sought-after new dining and shopping precincts.
“The redevelopment of the former ‘death mall’ site will connect Redfern seamlessly to Surry Hills and the Tech Central precinct,” she said.
Source: PropTrack | Median price – rolling 12 months ending Nov 2025. Supply – YoY change in listings. Demand – YoY change in number of key enquiries per listing. Buy Median price Annual change Supply Demand House $1,975,000 3% -2% 8% Unit $1,203,000 14% -11% -4% Source: PropTrack | 10 yr price growth – change in price over past year compared to 2015. Rent – weekly median price. Vacancy rate – percentage of available rentals (filter: minimum 5 vacant properties in suburb). Gross rental yield – median percentage of a property’s value received as rental income. Invest 10 year price growth Rent Change Vacancy rate Gross yield House 49% $1,000 -9% 2.1% 2.8% Unit 48% $800 0% 0.9% 4.4%
Rosebery
Population Distance to capital Main demographic 13,533 6km 30-34 years
Nominated by: Veronica Morgan
Nominated for: Population growth, demographic change
If you’re not a local, chances are you haven’t been to Rosebery in a while – or perhaps you’ve sped past its sleepy Californian Bungalows while weaving through traffic along Gardeners Road on the way to the airport or beach.
But Rosebery is a tale of two halves – and well on the way to becoming a cultural destination in its own right.
To its south and east, charming freestanding homes on large blocks sit along quiet, tree-lined streets.
To its north, large contemporary apartment complexes, funky warehouse conversions and a buzzing café and dining scene has emerged on the doorstep of the $13 billion Green Square precinct.
For buyers, patience is required – but there’s promise ahead, according to Veronica Morgan.
She said the transformation of mixed-use destinations like The Cannery – a gourmet dining destination that was once the canning factory for food brand Rosella – are shifting the area from raw development zone to established community.
“Apartment buyers should be selective – focus on small, boutique complexes with architectural distinction or unique positioning to avoid blending into the high-rise crowd,” Ms Morgan said.
Source: PropTrack | Median price – rolling 12 months ending Nov 2025. Supply – YoY change in listings. Demand – YoY change in number of key enquiries per listing. Buy Median price Annual change Supply Demand House $2,445,000 3% 4% 10% Unit $915,000 -2% -1% 6% Source: PropTrack | 10 yr price growth – change in price over past year compared to 2015. Rent – weekly median price. Vacancy rate – percentage of available rentals (filter: minimum 5 vacant properties in suburb). Gross rental yield – median percentage of a property’s value received as rental income. N/A – not enough data for accurate reading. Invest 10 year price growth Rent Change Vacancy rate Gross yield House 53% $1,280 7% N/A 2.9% Unit 7% $950 6% N/A 5.4%
Sans Souci
Population Distance to capital Main demographic 10,864 15km 50-54 years
Nominated by: John McGrath
Nominated for: Location
There have been plenty of picks around the new Western Sydney airport, but let’s not forget the soon-to-be ‘premium’ airstrip – the existing Sydney airport which operates with a curfew (i.e. no overnight noise) near the heart of the city.
High-flyers wanting a smooth trip to their next international destination will love the convenience of Sans Souci, a bayside suburb that also feels like a holiday destination in its own right.
Translating to ‘carefree’ in French, John McGrath said buyers will feel like they’re “on vacation every day” in Sans Souci.
“Part of the great southern suburbs of Sydney, on the water, and only 12 minutes to the airport on a good run. What more could you want?”
The suburb’s solid brick homes with generous gardens are reflective of the many Greek migrants who settled in the area during the post-war era, though as younger families move in, many modern McMansions are springing up.
And you don’t even need to speak French to love calling Sans Souci home, Mr McGrath added.
“Bonnes vacances.”
Source: PropTrack | Median price – rolling 12 months ending Nov 2025. Supply – YoY change in listings. Demand – YoY change in number of key enquiries per listing. Buy Median price Annual change Supply Demand House $2,700,000 17% 17% -4% Unit $1,125,000 5% -6% 14% Source: PropTrack | 10 yr price growth – change in price over past year compared to 2015. Rent – weekly median price. Vacancy rate – percentage of available rentals (filter: minimum 5 vacant properties in suburb). Gross rental yield – median percentage of a property’s value received as rental income. Invest 10 year price growth Rent Change Vacancy rate Gross yield House 90% $1,000 5% 0.8% 2.2% Unit 49% $680 -1% 1.1% 3.8%
Silverdale
Population Distance to capital Main demographic 4,543 57km 0-4 years
Nominated by: Matt Lahood
Nominated for: Population growth, investment prospects, family appeal
With a main demographic of 0-4 years old (in fact, a third of the population is aged below 20), you’d be hard pressed to find a more family-oriented community than Silverdale.
Tucked against the base of the Blue Mountains near the historic town of Warragamba, Silverdale predominantly offers sprawling acreages and solid family homes on large blocks, though house and land packages in the suburb’s new estates offer more affordable options.
Matt Lahood expects land values to rise as the opening of the Western Sydney airport and aerotropolis creates tens of thousands of direct and indirect jobs between now and 2030.
“The airport will operate 24/7 driving the need for people who work both for the airport itself and associated cafes and retail will need to live closer than they would if it operated standard hours,” Mr Lahood said.
House prices have almost doubled in the past decade to a median $1.3m, according to PropTrack. Due to the suburb’s limited number of apartments, there were not enough sales to produce price data for units.
Source: PropTrack | Median price – rolling 12 months ending Nov 2025. Supply – YoY change in listings. Demand – YoY change in number of key enquiries per listing. Buy Median price Annual change Supply Demand House $1,292,000 4% -9% 26% Unit N/A N/A N/A N/A Source: PropTrack | 10 yr price growth – change in price over past year compared to 2015. Rent – weekly median price. Vacancy rate – percentage of available rentals (filter: minimum 5 vacant properties in suburb). Gross rental yield – median percentage of a property’s value received as rental income. N/A – not enough data for accurate reading. Invest 10 year price growth Rent Change Vacancy rate Gross yield House 94% $800 11% 3.8% 3.1% Unit N/A N/A N/A N/A N/A
South Coogee
Population Distance to capital Main demographic 5,611 7km 50-54 years
Nominated by: Veronica Morgan
Nominated for: Location, affordability
With a median house price of $4.45 million, South Coogee is the most expensive suburb included in this year’s Hot 100 – yet affordability is one of the reasons Veronica Morgan has nominated the beachside hotspot.
But hey – that’s Sydney for you, and this is one of Australia’s most expensive and exclusive pockets.
South Coogee is the priciest suburb on this year’s list. Picture: realestate.com.au
Offering eastern suburbs living at a more reasonable entry point, Ms Morgan said South Coogee’s lifestyle equation is strong: “sea breezes, surf and suburban calm without Bondi’s price tag.”
With such a lifestyle on offer, residents rarely want to leave. According to PropTrack the average hold period for houses in South Coogee is 16 years.
House prices have jumped 117% in the past ten years, and units offer a more affordable entry point at a median of $1.4m, which is up 11% in the past 12 months.
Source: PropTrack | Median price – rolling 12 months ending Nov 2025. Supply – YoY change in listings. Demand – YoY change in number of key enquiries per listing. Buy Median price Annual change Supply Demand House $4,450,000 1% 22% -2% Unit $1,390,000 11% 10% 15% Source: PropTrack | 10 yr price growth – change in price over past year compared to 2015. Rent – weekly median price. Vacancy rate – percentage of available rentals (filter: minimum 5 vacant properties in suburb). Gross rental yield – median percentage of a property’s value received as rental income. N/A – not enough data for accurate reading. Invest 10 year price growth Rent Change Vacancy rate Gross yield House 117% $1,700 7% N/A 2.2% Unit 43% $850 -1% N/A 3.4%
St Marys
Population Distance to capital Main demographic 13,256 42km 25-29 years
Nominated by: Mathew Tiller
Nominated for: Affordability, infrastructure, investment prospects
St Marys has seen a lot of change since 2017, when it was confirmed a metro line would be constructed connecting the suburb to the soon-to-open Western Sydney airport and new Bradfield city – setting it up as a strategic link connecting international passengers with the rest of Sydney.
A demographic shift is underway from its traditional working-class roots as old fibro homes on large blocks are demolished and replaced with townhouses and units, attracting families and young professionals into the area seeking relative affordability and proximity to new jobs.
“St Marys sits in Sydney’s west, right in the Western Sydney airport and new metro corridor,” Mathew Tiller said.
“First-home buyers like that you can still buy a house in greater Sydney without leaving the city. Investors are watching rental demand and improved transport links.
“As new infrastructure lands, demand is expected to build rather than fade.”
Source: PropTrack | Median price – rolling 12 months ending Nov 2025. Supply – YoY change in listings. Demand – YoY change in number of key enquiries per listing. Buy Median price Annual change Supply Demand House $1,058,000 13% -4% 30% Unit $691,000 9% -11% 18% Source: PropTrack | 10 yr price growth – change in price over past year compared to 2015. Rent – weekly median price. Vacancy rate – percentage of available rentals (filter: minimum 5 vacant properties in suburb). Gross rental yield – median percentage of a property’s value received as rental income. Invest 10 year price growth Rent Change Vacancy rate Gross yield House 89% $540 4% 1.9% 2.7% Unit 63% $530 2% 1.4% 4.2%
Tamworth
Population Distance to capital Main demographic 43,874 310km 30-34 years
Nominated by: Belinda Connor and Simon Pressley
Nominated for: Family appeal, investment prospects
Known as Australia’s country music capital, Tamworth offers a balance of rural charm and modern convenience.
But with less than 300 homes currently listed for sale on realestate.com.au in a city of more than 65,000 people (across the broader region), Simon Pressley said Tamworth is facing its lowest volume in more than 15 years.
“Double-digit rates of house price growth are likely for 2026,” Mr Pressley said.
Tight supply could lead to double digit price growth in the NSW regional town in 2026 according to Simon Pressley. Picture: realestate.com.au
As the largest regional centre in northern NSW, Tamworth’s economy is diverse. Historically centred on agriculture and livestock, the city underpins jobs in food processing plants, transport and logistics networks, and equipment manufacturing.
“Retail and health are its biggest employment sectors. And a suite of aviation services is a point of difference,” Mr Pressley said. “The already strong local economy has a project pipeline that includes freight logistics upgrades, renewable energy and education.”
Also nominated by Belinda Connor for its “friendly, close-knit community, affordable housing, and a relaxed lifestyle” – Tamworth is one of seven high-conviction picks in this year’s list.
“With great schools, healthcare, and job opportunities, especially in agriculture, education, health, and retail, [as well as] strong transport links, Tamworth is appealing for families and professionals alike,” Ms Connor said.
It’s not the first time Tamworth has made the Hot 100, with the regional city also nominated in 2023. As the suburb of Tamworth only captures the commercial city centre, we’ve used data from East Tamworth to show residential price movements in the tables below.
Source: PropTrack | Median price – rolling 12 months ending Nov 2025. Supply – YoY change in listings. Demand – YoY change in number of key enquiries per listing. N/A – not enough data for accurate reading. Buy Median price Annual change Supply Demand House $680,000 5% 48% 18% Unit $339,000 -7% N/A N/A Source: PropTrack | 10 yr price growth – change in price over past year compared to 2015. Rent – weekly median price. Vacancy rate – percentage of available rentals (filter: minimum 5 vacant properties in suburb). Gross rental yield – median percentage of a property’s value received as rental income. Invest 10 year price growth Rent Change Vacancy rate Gross yield House 79% $508 6% 1.3% 4.2% Unit 65% $360 0% N/A 5.8%
Wallacia
Population Distance to capital Main demographic 1,711 52km 35-39 years
Nominated by: Matt Lahood
Nominated for: Population growth, investment prospects
Like Silverdale, Wallacia sits on Sydney’s western fringe at the foothills of the Blue Mountains.
Dominated by farmland and acreages, it feels like a world away from the new $5b Western Sydney international (Nancy Bird Walton) airport – even though you can drive there in minutes.
This proximity to the tens of thousands of direct and indirect jobs expected to be created by the airport between now and 2030 will see values in Wallacia rise in value, according to Matt Lahood.
“[Wallacia] is not under the direct flight path and therefore is highly attractive to not only owner occupiers but investors too who will reap the benefits of rising rental yields,” Mr Lahood said.
The volume of stock for sale is around a quarter lower than this time last year, with just a handful of homes currently listed on realestate.com.au.
Source: PropTrack | Median price – rolling 12 months ending Nov 2025. Supply – YoY change in listings. Demand – YoY change in number of key enquiries per listing. N/A – not enough data for accurate reading. Buy Median price Annual change Supply Demand House $1,113,000 22% -29% 14% Unit N/A N/A N/A N/A Source: PropTrack | 10 yr price growth – change in price over past year compared to 2015. Rent – weekly median price. Vacancy rate – percentage of available rentals (filter: minimum 5 vacant properties in suburb). Gross rental yield – median percentage of a property’s value received as rental income. Invest 10 year price growth Rent Change Vacancy rate Gross yield House 97% $650 -5% N/A 3.1% Unit N/A N/A N/A N/A 4.6%
Wyoming
Population Distance to capital Main demographic 10,111 54km 30-34 years
Nominated by: Matt Sharp
Nominated for: Affordability, family appeal, demographic shift
Wyoming sits just north of Gosford – the commercial and administrative hub of the central coast.
That connectivity to jobs and amenity is attracting younger families and investors seeking convenience, demand and relative affordability, according to Matt Sharp, the regional representative of the REBAA.
“It’s only a few minutes from Gosford CBD and the hospital, making it ideal for commuters and first-home buyers,” Mr Sharp said.
“The suburb’s larger blocks, school options and proximity to major infrastructure have attracted young families and investors, it continues to show steady capital growth.”
With a median house price of $930,000, Mr Sharp said Wyoming is more affordable than many of the more premium Central Coast suburbs
“There is a clear appeal for younger families looking to access good value near Gosford,” he said, adding ongoing amenity upgrades point to “solid longer-term prospects.”
Source: PropTrack | Median price – rolling 12 months ending Nov 2025. Supply – YoY change in listings. Demand – YoY change in number of key enquiries per listing. Buy Median price Annual change Supply Demand House $930,000 4% -4% 14% Unit $628,000 1% -28% -9% Source: PropTrack | 10 yr price growth – change in price over past year compared to 2015. Rent – weekly median price. Vacancy rate – percentage of available rentals (filter: minimum 5 vacant properties in suburb). Gross rental yield – median percentage of a property’s value received as rental income. N/A – not enough data for accurate reading. Invest 10 year price growth Rent Change Vacancy rate Gross yield House 100% $650 3% 1.1% 4.0% Unit 77% $520 11% N/A 4.3%
Zetland
Population Distance to capital Main demographic 12,622 4km 25-29 years
Nominated by: Veronica Morgan
Nominated for: Amenity, location, population growth
Many suburbs in this year’s Hot 100 are dominated by houses, so here’s a pick for those seeking inner-city convenience and cosmopolitan living with plenty of upside potential.
Zetland sits at the heart of the $13 billion Green Square precinct, one of Australia’s largest urban renewal projects that’s turning former industrial land into a brand-new community.
Zetland’s population density is on par with parts of Singapore and Hong Kong. Picture: realestate.com.au
The population has soared in recent years (well beyond the 12K residents counted in the 2021 Census), becoming one of Sydney’s most densely populated areas with an estimated 20,000 residents per square kilometre – on par with parts of Singapore and Hong Kong.
“This emerging precinct is a textbook case of population and demographic transformation,” Veronica Morgan said.
“Parks, a new public primary school in Zetland, and mixed-use destinations like The Cannery are shifting the area from raw development zone to established community.”
Zetland’s population is young – 70% of residents are aged between 20-39 years – with many renters and first-home buyers. Ms Morgan said investors should be selective, seeking boutique or smaller complexes with a unique offering over the plethora of mega high-rises.
Source: PropTrack | Median price – rolling 12 months ending Nov 2025. Supply – YoY change in listings. Demand – YoY change in number of key enquiries per listing. Buy Median price Annual change Supply Demand House $1,990,000 -8% -33% -23% Unit $962,000 -8% -4% -2% Source: PropTrack | 10 yr price growth – change in price over past year compared to 2015. Rent – weekly median price. Vacancy rate – percentage of available rentals (filter: minimum 5 vacant properties in suburb). Gross rental yield – median percentage of a property’s value received as rental income.Invest 10 year price growth Rent Change Vacancy rate Gross yield House 24% $1,335 -1% 4.9% 3.0% Unit 1% $1,050 5% 3.4% 5.8%
Jump back to the top
Victoria
After years of sluggish growth, home prices in Melbourne returned to a record high in September, eclipsing the previous peak in 2022. Of the 22 nominations across Victoria, nine are located in regional areas.
Ararat
Population Distance to capital Main demographic 8,500 189km 60-64 years
Nominated by: Simon Pressley
Nominated for: Affordability
Situated about 2 hours’ drive north-west of Melbourne and about an hour from Ballarat, Ararat’s economy is driven by agribusiness, cottage tourism and natural resources.
“I won’t at all be surprised if Ararat’s real estate values increase to be among Victoria’s highest [growth rates] over the next 3 to 5 years,” Simon Pressley said.
The regional town of Ararat offers affordable freestanding homes. Picture: realestate.com.au
The median house price in Ararat has already more than doubled over the past 20 years, yet it is still a relatively affordable $390,000, according to PropTrack data.
“Ararat is classic salt-of-the-earth Australiana. From the heritage buildings that line the main street, to a wide range of precious minerals, locally grown produce, various wineries, and impressive flora and fauna throughout the Grampians National Park,” Mr Pressley added.
Source: PropTrack | Median price – rolling 12 months ending Nov 2025. Supply – YoY change in listings. Demand – YoY change in number of key enquiries per listing. Buy Median price Annual change Supply Demand House $390,000 5% 3% 64% Unit $270,000 -11% 41% 45% Source: PropTrack | 10 yr price growth – change in price over past year compared to 2015. Rent – weekly median price. Vacancy rate – percentage of available rentals (filter: minimum 5 vacant properties in suburb). Gross rental yield – median percentage of a property’s value received as rental income. N/A – not enough data for accurate reading. Invest 10 year price growth Rent Change Vacancy rate Gross yield House 79% $390 3% 1.9% 5.2% Unit N/A $325 -4% N/A 5%
Brunswick West
Population Distance to capital Main demographic 14,746 6.5km 25-29 years
Nominated by: Cate Bakos
Nominated for: Amenity, location, investment prospects, infrastructure
A large suburb that spans from the Citylink tollway across to Brunswick, and all the way down to Parkville, there’s a lot to like about the suburban lifestyle on offer in Brunswick West.
“Compared to Brunswick and Brunswick East, Brunswick West houses are a bit more affordable, particularly for a suburb within 6kms of the CBD,” Cate Bakos said.
“It offers a great blend of apartments, townhouses, villa units, new developments and period houses. Boutique apartments, in particular, are very affordable.
“The introduction of a new train station at Parkdale is a win for the general area, and the existing tram services will be further bolstered by accessibility to rail with this new station,” Ms Bakos added.
Source: PropTrack | Median price – rolling 12 months ending Nov 2025. Supply – YoY change in listings. Demand – YoY change in number of key enquiries per listing. Buy Median price Annual change Supply Demand House $1,313,000 0% 14% 19% Unit $490,000 6% -16% 40% Source: PropTrack | 10 yr price growth – change in price over past year compared to 2015. Rent – weekly median price. Vacancy rate – percentage of available rentals (filter: minimum 5 vacant properties in suburb). Gross rental yield – median percentage of a property’s value received as rental income. Invest 10 year price growth Rent Change Vacancy rate Gross yield House 55% $700 -7% 0.7% 3.2% Unit 17% $475 0% 1.1% 4.9%
Carisbrook
Population Distance to capital Main demographic 1,192 133km 65-69 years
Nominated by: John McGrath
Nominated for: Affordability, investment prospects
The Gold Rush may have ended about 160 years ago, but according to John McGrath, “it seems it’s still possible to strike it rich in Victoria’s historic Central Goldfields region.”
Carisbrook, about 2 hours’ drive from Melbourne and 10 minutes from Maryborough, was once a bustling gold mining town, and today offers affordable homes, great local facilities and a strong sense of community.
“This heritage and tourism hotspot provides a laidback country lifestyle and small-town charm, along with easy access to the major centre of Maryborough just 7 kilometres to the west,” Mr McGrath said.
“And the good news is that the median home is still relatively affordable, for those who get in quick.”
Freestanding homes make up almost all of the town’s housing stock, so there is no data available for units in the tables below.
Source: PropTrack | Median price – rolling 12 months ending Nov 2025. Supply – YoY change in listings. Demand – YoY change in number of key enquiries per listing. N/A – not enough data for accurate reading. Buy Median price Annual change Supply Demand House $495,000 -20% -19% -10% Unit N/A N/A N/A N/A Source: PropTrack | 10 yr price growth – change in price over past year compared to 2015. Rent – weekly median price. Vacancy rate – percentage of available rentals (filter: minimum 5 vacant properties in suburb). Gross rental yield – median percentage of a property’s value received as rental income. Invest 10 year price growth Rent Change Vacancy rate Gross yield Houe 136% N/A N/A N/A N/A Unit N/A N/A N/A N/A N/A
Clyde North
Population Distance to capital Main demographic 31,681 46km 35-39 years
Nominated by: Mathew Scafidi
Nominated for: Affordability, infrastructure, investment prospects
One of Melbourne’s fastest-growing suburbs, Clyde North offers exceptional affordability and long-term growth potential, according to Matthew Scafidi.
“Situated in the south-east growth corridor, it’s supported by rapid population expansion, new infrastructure, and a strong pipeline of housing development.”
The suburb has expanded through the creation of new housing estates, and a new government secondary school opened this year for year 7 students to cater to the growing demand.
“It represents one of the city’s best opportunities for entry-level buyers and investors seeking solid yields and medium-term capital uplift as amenity continues to mature,” Mr Scafidi said.
Source: PropTrack | Median price – rolling 12 months ending Nov 2025. Supply – YoY change in listings. Demand – YoY change in number of key enquiries per listing. N/A – not enough data for accurate reading. Buy Median price Annual change Supply Demand House $740,000 3% 16% 11% Unit N/A N/A 15% 14% Source: PropTrack | 10 yr price growth – change in price over past year compared to 2015. Rent – weekly median price. Vacancy rate – percentage of available rentals (filter: minimum 5 vacant properties in suburb). Gross rental yield – median percentage of a property’s value received as rental income. Invest 10 year price growth Rent Change Vacancy rate Gross yield House 146% $590 -2% 2.7% 4.1% Unit N/A N/A N/A N/A N/A
Cranbourne East
Population Distance to capital Main demographic 24,679 44km 35-39 years
Nominated by: Nerida Consibee
Nominated for: Population growth
Signalling further confidence in Melbourne’s southeast growth corridor is the arrival of Cranbourne East onto this year’s Hot 100 list.
“This is one of Australia’s fastest-growing population areas, driven by large master-planned estates, new schools, and emerging retail and recreation hubs,” Nerida Conisbee said.
Cranbourne East’s population is growing rapidly. Picture: realestate.com.au
Neighbouring Clyde North, Cranbourne East’s median house price has jumped more than 75% over the past decade, according to Neoval data.
“The suburb’s family-oriented design and expanding infrastructure have created consistent demand from both local and migrant buyers.
“Its growth trajectory reflects the broader expansion of Melbourne’s southeast corridor,” Ms Conisbee added.
Source: PropTrack | Median price – rolling 12 months ending Nov 2025. Supply – YoY change in listings. Demand – YoY change in number of key enquiries per listing. N/A – not enough data for accurate reading. Buy Median price Annual change Supply Demand House $735,000 4% -9% 35% Unit N/A N/A 0% -13% Source: PropTrack | 10 yr price growth – change in price over past year compared to 2015. Rent – weekly median price. Vacancy rate – percentage of available rentals (filter: minimum 5 vacant properties in suburb). Gross rental yield – median percentage of a property’s value received as rental income. Invest 10 year price growth Rent Change Vacancy rate Gross yield House 75% $585 3% 2.7% 4.1% Unit N/A N/A N/A N/A N/A
Elsternwick
Population Distance to capital Main demographic 10,887 9km 30-34 years
Nominated by: Cate Bakos
Nominated for: Amenity, location, affordability
Hardly the hidden gem of Melbourne’s inner south, Elsternwick’s relative affordability, bustling high-street and its broad range of attractive property types made its case for selection in the Hot 100 a no-brainer for Cate Bakos.
“Elsternwick offers some stunning Victorian architecture, great Californian Bungalows, and a good blend of units for those who love the buzz of an area that offers amazing food, great shopping and good transport options,” Ms Bakos said.
Coming to national prominence during the 2017 season of The Block, the lid has been firmly kept on the suburb’s property prices despite its proximity to the city and Port Phillip Bay.
“Unlike its more expensive counterparts (including Brighton and Elwood), the median house price is still sub-$2m in Elsternwick.
“Glenhuntly Road dining options are diverse and plentiful too,” Ms Bakos added.
Source: PropTrack | Median price – rolling 12 months ending Nov 2025. Supply – YoY change in listings. Demand – YoY change in number of key enquiries per listing. Buy Median price Annual change Supply Demand House $1,935,000 2% -26% 22% Unit $690,000 5% -1% 19% Source: PropTrack | 10 yr price growth – change in price over past year compared to 2015. Rent – weekly median price. Vacancy rate – percentage of available rentals (filter: minimum 5 vacant properties in suburb). Gross rental yield – median percentage of a property’s value received as rental income. Invest 10 year price growth Rent Change Vacancy rate Gross yield House 26% $873 -2% 1.8% 2.5% Unit 27% $580 2% 0.6% 4.5%
Footscray
Population Distance to capital Main demographic 17,131 6.5km 30-34 years
Nominated by: Nerida Conisbee
Nominated for: Gentrification
Located just 6.5 kilometres from the centre of Melbourne, Footscray has undergone a decade of rapid gentrification that has seen its median house price skyrocket 40% over the same period, according to Neoval data.
“Once a working-class, industrial suburb, Footscray has evolved into a lively multicultural hub celebrated for its dining, arts, and community spirit,” Nerida Conisbee said.
Home to a diverse and multicultural population, a buzzing restaurant, bar and arts scene, Footscray was also recognised by Time Out on its ‘50 Coolest Neighbourhoods in the World’ list in 2019 and appeared on our Hot 100 list in 2023.
“Proximity to the Melbourne CBD and major universities has accelerated this transformation, with younger professionals and creatives replacing long-term residents.
“The suburb’s cultural and demographic shift continues to underpin its ongoing gentrification and sustained buyer demand,” Ms Conisbee said.
Source: PropTrack | Median price – rolling 12 months ending Nov 2025. Supply – YoY change in listings. Demand – YoY change in number of key enquiries per listing. Buy Median price Annual change Supply Demand House $916,000 -7% 5% 46% Unit $447,000 -15% -4% 27% Source: PropTrack | 10 yr price growth – change in price over past year compared to 2015. Rent – weekly median price. Vacancy rate – percentage of available rentals (filter: minimum 5 vacant properties in suburb). Gross rental yield – median percentage of a property’s value received as rental income. Invest 10 year price growth Rent Change Vacancy rate Gross yield House 39% $600 0% 2.1% 3.5% Unit -1% $520 4% 2.4% 5.8%
Grovedale
Population Distance to capital Main demographic 14,869 70km 30-34 years
Nominated by: Cate Bakos and Matt Lahood
Nominated for: Affordability, family appeal, gentrification, investment prospects, infrastructure
Located about a 15-minute drive from Geelong and 1 hour 20-minutes from Melbourne’s CBD, Grovedale ticks all the boxes as a suburb to watch, according to Cate Bakos and Matt Lahood, who both nominated the suburb.
“Grovedale’s median house price of $680,000 puts family homes within reach of Geelong’s established south,” Ms Bakos said.
Homes in Grovedale offer plenty of renovation potential. Picture: realestate.com.au
Residential estates began springing up in the suburb during the 1960’s and continued to spread between the 1970’s and 90’s, with large homes on sizeable blocks a common sight.
“[With] a local train station at Marshall, a university in neighbouring Waurn Ponds, and a large shopping centre nearby, these 1980’s and 1990’s houses allow room for updates and improvements.
“Most of the blocks measure above 600sqm, and developer interest has been evident over the last decade, too,” Ms Bakos added.
First-home buyers and investors have seen value in the Geelong region for some years, with Grovedale offering them the opportunity to add value to the existing stock.
“A lot of homes in the area have remained in original condition, with minor quality of life updates now [affording] the next wave of buyers [the chance] to add their own personal touches and further increase value over time,” Matt Lahood said.
Source: PropTrack | Median price – rolling 12 months ending Nov 2025. Supply – YoY change in listings. Demand – YoY change in number of key enquiries per listing. Buy Median price Annual change Supply Demand House $682,000 3% -2% 109% Unit $508,000 2% -2% 54% Source: PropTrack | 10 yr price growth – change in price over past year compared to 2015. Rent – weekly median price. Vacancy rate – percentage of available rentals (filter: minimum 5 vacant properties in suburb). Gross rental yield – median percentage of a property’s value received as rental income. N/A – not enough data for accurate reading. Invest 10 year price growth Rent Change Vacancy rate Gross yield House 84% $525 3% 1% 4% Unit 76% $440 2% N/A 4.3%
Herne Hill
Population Distance to capital Main demographic 3,507 67km 30-34 years
Nominated by: Cate Bakos
Nominated for: Affordability, family appeal, gentrification, investment prospects
Under a 15-minute drive west of the Geelong CBD is the small suburb of Herne Hill, which is made up of just 35 streets.
“Still a sleepy suburb compared to bustling Geelong West, Herne Hill has some beautiful character homes on offer, and the median house price is only a tad above $700,000,” Cate Bakos said.
“Geelong’s west has continued to flourish, and Herne Hill is tucked just behind Manifold Heights, which has performed well in Geelong’s post-Covid recovery.
“My favourite attribute in Herne Hill (aside from the pretty houses) is the rail trail walk; the old disused rail is now a tranquil track between parklands,” Ms Bakos enthused.
Source: PropTrack | Median price – rolling 12 months ending Nov 2025. Supply – YoY change in listings. Demand – YoY change in number of key enquiries per listing. Buy Median price Annual change Supply Demand House $755,000 12% 39% 57% Unit $340,000 -3% -10% 39% Source: PropTrack | 10 yr price growth – change in price over past year compared to 2015. Rent – weekly median price. Vacancy rate – percentage of available rentals (filter: minimum 5 vacant properties in suburb). Gross rental yield – median percentage of a property’s value received as rental income. N/A – not enough data for accurate reading. Invest 10 year price growth Rent Change Vacancy rate Gross yield House 103% $500 4% N/A 3.7% Unit 62% $370 9% N/A 4.8%
Huntly
Population Distance to capital Main demographic 3,585 140km 0-4 years
Nominated by: Matt Lahood
Nominated for: Affordability, investment prospects
Located around 2 hours’ drive from Melbourne and 12 kilometres north-east of Bendigo, Huntly offers its community – which largely consists of young families – attractive amenities including a hotel, schools, shops and sporting facilities.
“Huntly continues to cement itself as one of Bendigo’s fastest-growing hotspots, fuelled by new schools, expanding retail and dining options, and strong community infrastructure,” Matt Lahood said.
The town’s population has been on the rise in recent years, and the emergence of new housing estates has contributed to its residential growth.
“With record sale prices being achieved and demand showing no signs of slowing, Huntly appeals to families and investors seeking affordability, growth and modern living in a thriving outer-Bendigo pocket,” Mr Lahood said.
Source: PropTrack | Median price – rolling 12 months ending Nov 2025. Supply – YoY change in listings. Demand – YoY change in number of key enquiries per listing. N/A – not enough data for accurate reading. Buy Median price Annual change Supply Demand House $599,000 9% -9% 43% Unit N/A N/A N/A N/A Source: PropTrack | 10 yr price growth – change in price over past year compared to 2015. Rent – weekly median price. Vacancy rate – percentage of available rentals (filter: minimum 5 vacant properties in suburb). Gross rental yield – median percentage of a property’s value received as rental income. Invest 10 year price growth Rent Change Vacancy rate Gross yield House 76% $530 6% 2.8% 4.5% Unit N/A N/A N/A N/A N/A
Kennington
Population Distance to capital Main demographic 5,880 130km 25-29 years
Nominated by: Matt Lahood
Nominated for: Family appeal, investment prospects
Its well-established amenities, leafy streets and proximity to Bendigo’s CBD, position Kennington as a long-term favourite for buyers chasing quality, convenience and capital growth, according to Matt Lahood.
“Kennington remains one of Bendigo’s most consistently sought-after suburbs, celebrated for its blend of timeless, untouched homes, beautifully renovated residences and contemporary new builds,” Mr Lahood said.
Kennington is highly sought-after with supply unable to keep up with demand. Picture: realestate.com.au
The suburb, which was largely developed between the 1960s and 80s, offers a diverse range of housing on traditional sized allotments, which are now ripe for infill development.
“Close to some of Bendigo’s best schools and [within] walking distance to Bendigo’s CBD, the landlocked suburb is now unable to meet buyer demand and properties are receiving multiple offers from both owner occupiers looking for lifestyle and investors looking to capitalise on the location demand,” Mr Lahood added.
Source: PropTrack | Median price – rolling 12 months ending Nov 2025. Supply – YoY change in listings. Demand – YoY change in number of key enquiries per listing. Buy Median price Annual change Supply Demand House $603,000 4% 12% 77% Unit $500,000 19% -5% 30% Source: PropTrack | 10 yr price growth – change in price over past year compared to 2015. Rent – weekly median price. Vacancy rate – percentage of available rentals (filter: minimum 5 vacant properties in suburb). Gross rental yield – median percentage of a property’s value received as rental income. Invest 10 year price growth Rent Change Vacancy rate Gross yield House 81% $480 7% 1.8% 4.5% Unit 96% $410 8% 3.3% 4.8%
Lalor
Population Distance to capital Main demographic 23,219 17km 35-39 years
Nominated by: Cate Bakos
Nominated for: Affordability, family appeal, gentrification, demographic change, investment prospects, infrastructure
Lalor has experienced strong growth over the past 12 months with home prices increasing 8%, according to PropTrack data, but there’s more in store for this suburb, which sits about 17 kilometres to Melbourne’s north.
“Located conveniently near the ring road, and offering train station amenity along High Street, Lalor is one of the last options in an established area where a three-bedroom, brick veneer property on 500sqm within 18km of the CBD is still within $800,000,” Cate Bakos said.
The suburb and surrounding areas boast a variety of schools, and subdivision and unit construction isn’t dominant, with original houses remaining prevalent on many streets.
But that’s not all.
“What I love most about this area is the abundance of great produce and delicatessen items. The locals know how to cook, and food shopping is a great experience,” Ms Bakos said.
Source: PropTrack | Median price – rolling 12 months ending Nov 2025. Supply – YoY change in listings. Demand – YoY change in number of key enquiries per listing. Buy Median price Annual change Supply Demand House $756,000 8% 1% 64% Unit $565,000 9% 6% 16% Source: PropTrack | 10 yr price growth – change in price over past year compared to 2015. Rent – weekly median price. Vacancy rate – percentage of available rentals (filter: minimum 5 vacant properties in suburb). Gross rental yield – median percentage of a property’s value received as rental income. Invest 10 year price growth Rent Change Vacancy rate Gross yield House 72% $520 0% 1.6% 3.7% Unit 74% $480 4% 1.7% 4.5%
Lilydale
Population Distance to capital Main demographic 17,348 34km 50-54 years
Nominated by: Cate Bakos
Nominated for: Affordability, location, demographic change
Located at the foothills of the Yarra Valley, and about an hour commute to the Melbourne CBD, Lilydale has been gentrifying for some years now.
“Lilydale offers rail for commuters, and the housing options on offer are quite diverse. From townhouses to character homes, first-homebuyers, upgraders and downsizers all have a good array to choose from,” Cate Bakos said.
With the median house price still under $900,000, it’s anticipated first-home buyers will take advantage of the federal government’s First Home Guarantee Scheme to buy into the suburb, which is sure to attract their family and friends for a visit if they do.
“[With] the wineries and day-tripper locations such as Healesville a short ride away, it’s a nice way to spend a weekend locally,” Ms Bakos said.
Source: PropTrack | Median price – rolling 12 months ending Nov 2025. Supply – YoY change in listings. Demand – YoY change in number of key enquiries per listing. Buy Median price Annual change Supply Demand House $861,000 4% 15% 16% Unit $630,000 6% 25% 28% Source: PropTrack | 10 yr price growth – change in price over past year compared to 2015. Rent – weekly median price. Vacancy rate – percentage of available rentals (filter: minimum 5 vacant properties in suburb). Gross rental yield – median percentage of a property’s value received as rental income. Invest 10 year price growth Rent Change Vacancy rate Gross yield House 65% $570 -5% N/A 3.8% Unit 63% $498 -4% 1.7% 4.5%
Mildura
Population Distance to capital Main demographic 56,972 476km 30-34 years
Nominated by: Matt Lahood
Nominated for: Investment prospects, affordability, lifestyle
Straddling the border with New South Wales, and with South Australia about an hour and a half away, Mildura’s house prices are climbing, rising by more than 13% over the past 12-months to $520,000.
And its strong performance isn’t going unnoticed.
“Investors and first-home buyers are flocking to Mildura because of its affordability and the gentrification of the town,” Matt Lahood said.
Home prices in Mildura have experienced double digit growth in the past 12 months, with more growth projected in the year ahead. Picture: realestate.com.au
Nestled on the banks of the Murray River, the historic, charming and increasingly vibrant town has become an investor hotspot, and earlier this year emerged as Victoria’s most active regional property market with 706 homes traded in the most recent financial year.
“In particular, investors from Melbourne and Sydney are seeing value and while this is causing more properties to be available to rent, there is still room for growth in the area,” Matt Lahood said.
“The large volume of jobs in agriculture and the transient nature of [local] industries sees a bigger need for rental properties than city areas and due to this there will always be strong rental demand.
“It is also a popular destination for retirees due to the climate and its status as ‘the tropical north’ of Victoria,” Mr Lahood added.
Source: PropTrack | Median price – rolling 12 months ending Nov 2025. Supply – YoY change in listings. Demand – YoY change in number of key enquiries per listing. Buy Median price Annual change Supply Demand House $520,000 13% -11% 108% Unit $344,000 9% -17% 104% Source: PropTrack | 10 yr price growth – change in price over past year compared to 2015. Rent – weekly median price. Vacancy rate – percentage of available rentals (filter: minimum 5 vacant properties in suburb). Gross rental yield – median percentage of a property’s value received as rental income. Invest 10 year price growth Rent Change Vacancy rate Gross yield House 108% $495 5% 2.4% 5% Unit 115% $370 9% 1.6% 5.8%
Mount Waverley
Population Distance to capital Main demographic 35,340 16km 50-54 years
Nominated by: Cate Bakos
Nominated for: Amenity, family appeal
A large and well-established suburb about 16 kilometres south-east of Melbourne’s CBD, Mount Waverley is known for its leafy streets, family-friendly atmosphere and convenient location.
“Glen Waverley has been an evergreen suburb for a long time, offering glorious, leafy streets, great townhouses and houses, and a very impressive shopping precinct at The Glen,” Cate Bakos said.
“Mount Waverley is a little bit sleepier, but closer to the CBD and offering its own cafes and restaurants, too,” she said.
With rail and bus links nearby, a variety of property types, a range of public and private schools, and a combination of local shopping options (as well as easy access to Chadstone and The Glen), there aren’t many boxes Mount Waverley doesn’t tick.
Source: PropTrack | Median price – rolling 12 months ending Nov 2025. Supply – YoY change in listings. Demand – YoY change in number of key enquiries per listing. Buy Median price Annual change Supply Demand House $1,650,000 1% 6% 16% Unit $1,100,000 -1% 9% 18% Source: PropTrack | 10 yr price growth – change in price over past year compared to 2015. Rent – weekly median price. Vacancy rate – percentage of available rentals (filter: minimum 5 vacant properties in suburb). Gross rental yield – median percentage of a property’s value received as rental income. Invest 10 year price growth Rent Change Vacancy rate Gross yield House 31% $710 1% 1.2% 2.4% Unit 39% $688 3% 0.9% 3.4%
Oakleigh
Population Distance to capital Main demographic 8,442 15km 25-29 years
Nominated by: Cate Bkos
Nominated for: Infrastructure, location, gentrification and family appeal
Famed for its Greek community, restaurants, cafes and cake shops, Oakleigh in Melbourne’s leafy south-east offers “fantastic value,” despite a hefty median house price above $1.3m, Cate Bakos said.
“Oakleigh offers fabulous amenities, and the new metro rail link includes Oakleigh Station, offering opportunities for many commuters,” she said.
Boasting wonderful dining in and around Eaton Mall, the housing styles are beautiful too, with plenty of period and character houses perfect for families and couples.
“Situated near major arterials and Chadstone shopping centre, and offering many good schools in the area, Oakleigh is destined for greater things,” Ms Bakos added.
Source: PropTrack | Median price – rolling 12 months ending Nov 2025. Supply – YoY change in listings. Demand – YoY change in number of key enquiries per listing. Buy Median price Annual change Supply Demand House 1,366,000 3% -7% 29% Unit $573,000 1% -2% 42% Source: PropTrack | 10 yr price growth – change in price over past year compared to 2015. Rent – weekly median price. Vacancy rate – percentage of available rentals (filter: minimum 5 vacant properties in suburb). Gross rental yield – median percentage of a property’s value received as rental income. Invest 10 year price growth Rent Change Vacancy rate Gross yield House 42% $690 1% N/A 2.8% Unit 19% $600 3% 1.7% 5.1%
Port Melbourne
Population Distance to capital Main demographic 17,633 4km 35-39 years
Nominated by: Nerida Conisbee
Nominated for: Location
Port Melbourne’s median house price has grown strongly over the past decade, with buyers attracted to its unmatched location, which offers beachside living just minutes from Melbourne’s CBD.
“Once a working port precinct, it has transformed into a high-end residential and lifestyle destination, attracting professionals who want both coastal charm and urban access,” Nerida Conisbee said.
Port Melbourne has transformed from port precinct to affluent area. Picture: Getty
Over recent decades, the suburb has transformed from one of the city’s poorer neighbourhoods into one of its most blue-chip.
Many of the suburb’s former factories and warehouses have been converted into high-end apartment towers, while bustling Bay Street offers shopping, dining and nightlife that attracts visitors from across the city.
“Its mix of heritage terraces, contemporary apartments, and bayside parks underline why it remains one of Melbourne’s most coveted locations,” Ms Conisbee said.
Source: PropTrack | Median price – rolling 12 months ending Nov 2025. Supply – YoY change in listings. Demand – YoY change in number of key enquiries per listing. Buy Median price Annual change Supply Demand House $1,569,000 1% 12% 20% Unit $700,000 -3% 6% 14% Source: PropTrack | 10 yr price growth – change in price over past year compared to 2015. Rent – weekly median price. Vacancy rate – percentage of available rentals (filter: minimum 5 vacant properties in suburb). Gross rental yield – median percentage of a property’s value received as rental income. Invest 10 year price growth Rent Change Vacancy rate Gross yield House 27% $950 0% 1.8% 3% Unit 7% $680 1% 1% 4.7%
Ringwood East
Population Distance to capital Main demographic 10,764 25km 45-49 years
Nominated by: Matthew Scafidi
Nominated for: Family appeal, affordability, infrastructure, investment prospects
25 kilometres directly east of Melbourne’s CBD, Ringwood East offers excellent family appeal and remains relatively affordable compared to its eastern neighbours, Matt Scafidi said.
“With major road and rail connectivity, strong schooling options, and amenity including nearby Eastland Shopping Centre, it attracts both home buyers and investors,” he said.
House prices in Ringwood East have risen sharply in the past 12 months, and Mr Scafidi expects this upward trajectory to continue.
“The area is also benefiting from continued infrastructure investment, including the upgraded Ringwood East train station, and offers a mix of established homes and development opportunities, indicating future upside,” Mr Scafidi said.
Source: PropTrack | Median price – rolling 12 months ending Nov 2025. Supply – YoY change in listings. Demand – YoY change in number of key enquiries per listing. Buy Median price Annual change Supply Demand House $1,062,000 7% 1% 42% Unit $725,000 -1% 11% 35% Source: PropTrack | 10 yr price growth – change in price over past year compared to 2015. Rent – weekly median price. Vacancy rate – percentage of available rentals (filter: minimum 5 vacant properties in suburb). Gross rental yield – median percentage of a property’s value received as rental income. Invest 10 year price growth Rent Change Vacancy rate Gross yield House 48% $620 2% 1.3% 3.2% Unit 42% $520 0% 1.2% 3.9%
Tarneit
Population Distance to capital Main demographic 56,370 26km 35-39 years
Nominated by: Mathew Tiller
Nominated for: Affordability
Home to 56,000 people, Tarneit is a “population magnet” according to Mathew Tiller and is the largest suburb by that measure to make this year’s Hot 100.
“The price point is still within reach for first-home buyers, so demand is broad. New supply is being absorbed by a steady flow of young families rather than sitting unsold,” Mathew Tiller said.
Once little more than grazing land, a huge uptick in residential subdivision began more than 20 years ago with the emergence of large housing estates ushering in the urban spawl.
Today, a large variety of schools and shopping centres are also well-established in Tarneit.
“It’s seen as a practical, ready‑to‑move‑in alternative to buying land and waiting to build,” Mr Tiller said.
Source: PropTrack | Median price – rolling 12 months ending Nov 2025. Supply – YoY change in listings. Demand – YoY change in number of key enquiries per listing. Buy Median price Annual change Supply Demand House $663,000 2% 14% 10% Unit $440,000 -6% -26% 36% Source: PropTrack | 10 yr price growth – change in price over past year compared to 2015. Rent – weekly median price. Vacancy rate – percentage of available rentals (filter: minimum 5 vacant properties in suburb). Gross rental yield – median percentage of a property’s value received as rental income. Invest 10 year price growth Rent Change Vacancy rate Gross yield House 67% $525 -2% 5.1% 4.1% Unit 47% $450 -2% 3.2% 4.4%
Werribee
Population Distance to capital Main demographic 50,027 28km 30-34 years
Nominated by: Mathew Tiller
Nominated for: Employment prospects, affordability, lifestyle
Almost smack bang between Melbourne and Geelong by drive time, it will take residents about 40 minutes to get to either city.
“Werribee sits in Melbourne’s south‑west and has become one of the city’s most affordable true house markets with rail access,” Mathew Tiller said.
Beginning its urban development in the 1990’s, Werribee’s house prices have almost doubled in the past 10 years, but the median remains an attractive $639,000.
The suburb houses a significant population largely made up of young families and is also home to tourist attractions such as Werribee Open Range Zoo, Werribee Park and the Victoria State Rose Garden.
“Health, education and retail anchors in the area mean people can live and work locally. That appeals to first-home buyers and young families who want a backyard without heading to the far fringe.
“Consistent sales activity shows a real depth in demand, not just one‑off spikes,” Mr Tiller noted.
Source: PropTrack | Median price – rolling 12 months ending Nov 2025. Supply – YoY change in listings. Demand – YoY change in number of key enquiries per listing. Buy Median price Annual change Supply Demand House $639,000 5% -10% 51% Unit $445,000 3% -13% 67% Source: PropTrack | 10 yr price growth – change in price over past year compared to 2015. Rent – weekly median price. Vacancy rate – percentage of available rentals (filter: minimum 5 vacant properties in suburb). Gross rental yield – median percentage of a property’s value received as rental income. Invest 10 year price growth Rent Change Vacancy rate Gross yield House 96% $460 -4% 3.6% 3.7% Unit 56% $410 3% 2.3% 4.5%
Williamstown
Population Distance to capital Main demographic 14,407 9km 50-54 years
Nominated by: Matt Lahood and Cate Bakos
Nominated for: Amenity, family appeal, location, investment prospects, infrastructure
Williamstown has always been known as the “jewel in the west” and when compared to eastern beachside suburbs, its affordability is “astounding”, according to Cate Bakos.
Little wonder then the suburb received two expert nominations for this year’s Hot 100, with Matt Lahood also singing its praises.
“Williamstown is one of Melbourne’s hottest suburbs thanks to its unbeatable blend of bay views, village charm, and quick access to the CBD,” he said.
Williamstown received two expert nominations in this year’s Hot 100. Picture: realestate.com.au
Boasting spectacular views of the city across the bay, Williamstown has a unique maritime feel, harking back to its days as Melbourne’s first port.
Transport options into the city are also close at hand, with road, rail and ferry links capable of delivering residents into the CBD in under 30 minutes.
“Now that the western tunnel work and freeway enhancements are behind us, the travel times for inner westies have been shortened,” Ms Bakos said.
“With top schools, thriving cafes, and a tight-knit coastal community, it offers an enviable lifestyle that buyers are constantly competing for,” Mr Lahood concurred.
“Williamstown continues to pull crowds every weekend, and for those who are fortunate enough to call this glorious suburb home, they will understand the magic of postcode 3016,” Ms Bakos enthused.
Source: PropTrack | Median price – rolling 12 months ending Nov 2025. Supply – YoY change in listings. Demand – YoY change in number of key enquiries per listing. Buy Median price Annual change Supply Demand House $1,566,000 0% -2% 60% Unit $820,000 20% -7% 30% Source: PropTrack | 10 yr price growth – change in price over past year compared to 2015. Rent – weekly median price. Vacancy rate – percentage of available rentals (filter: minimum 5 vacant properties in suburb). Gross rental yield – median percentage of a property’s value received as rental income. Invest 10 year price growth Rent Change Vacancy rate Gross yield House 40% $830 5% 1.5% 2.7% Unit 47% $510 -2% 1.6% 4.2%
Winter Valley
Population Distance to capital Main demographic 3,440 106km 25-29 years
Nominated by: Mathew Tiller
Nominated for: Affordability
One of the youngest suburbs to feature on this year’s Hot 100, Winter Valley will celebrate its tenth anniversary in February 2026.
“Winter Valley on the Ballarat fringe is delivering new family homes with space, schools and parks at a price well below Melbourne,” Mathew Tiller said.
About a 10-minute drive from Ballarat and just under 2 hours from Melbourne’s CBD, the suburb is dominated by young families seeking affordability and strong growth potential.
“It’s popular with young upgraders who want four bedrooms and a backyard, not an apartment.
“Ballarat’s lifestyle plus commute story continues to attract long‑term residents. Low rental vacancy [rates] and steady demand are helping support values,” Mr Tiller added.
Almost all housing in Winter Valley is freestanding, so there’s insufficient data for unit stats in the tables below.
Source: PropTrack | Median price – rolling 12 months ending Nov 2025. Supply – YoY change in listings. Demand – YoY change in number of key enquiries per listing. N/A – not enough data for accurate reading. Buy Median price Annual change Supply Demand House $570,000 3% -20% 76% Unit N/A N/A N/A N/A Source: PropTrack | 10 yr price growth – change in price over past year compared to 2015. Rent – weekly median price. Vacancy rate – percentage of available rentals (filter: minimum 5 vacant properties in suburb). Gross rental yield – median percentage of a property’s value received as rental income. Invest 10 year price growth Rent Change Vacancy rate Gross yield House 56% $460 3% 1.5% 4% Unit N/A N/A N/A N/A N/A
Jump back to the top
Queensland
With 17 nominations in this year’s Hot 100, the theme across Queensland is affordability and growth – with many picks for outer fringe Brisbane, and the locations set to benefit from the upcoming Olympics.
Baringa
Population Distance to capital Main demographic 4,604 74km 30-34 years
Nominated by: Mathew Tiller
Nominated for: Lifestyle, family appeal, population growth, amenity
Baringa is a relatively new suburb on the Sunshine Coast that’s family friendly and a short drive from Caloundra and other popular beach spots.
Homes remain affordable compared to those closer to the coast. Picture: realestate.com.au
Families like that it feels established rather than ‘promised’, according to LJ Hooker’s Mathew Tiller.
“Baringa is part of the new Aura community on the Sunshine Coast, which brings schools, parks and local jobs together in one planned area,” Mr Tiller said.
“Compared with traditional Sunshine Coast beach suburbs, modern family homes still look good value.”
He said tight stock levels and strong migration into the Sunshine Coast has kept pressure on home prices in this burgeoning location.
Source: PropTrack | Median price – rolling 12 months ending Nov 2025. Supply – YoY change in listings. Demand – YoY change in number of key enquiries per listing. N/A – not enough data for accurate reading. Buy Median price Annual change Supply Demand House $850,000 6% -28% 49% Unit N/A N/A N/A N/A Source: PropTrack | 10 yr price growth – change in price over past year compared to 2015. Rent – weekly median price. Vacancy rate – percentage of available rentals (filter: minimum 5 vacant properties in suburb). Gross rental yield – median percentage of a property’s value received as rental income. Invest 10 year price growth Rent Change Vacancy rate Gross yield House N/A $700 3% N/A 4.0% Unit N/A $650 -1% N/A 4.0%
Bray Park
Population Distance to capital Main demographic 10,271 20km 35-39 years
Nominated by: Melinda Jennison
Nominated for: Affordability, investment prospects, infrastructure
Located in Brisbane’s northern suburbs, Bray Park offers relative value for buyers and investors, with a median home price below the city’s average.
The established suburb has a range of primary and secondary schools, shops, green spaces, and public transport options.
According to REBAA president Melinda Jennison, rents have been on a consistent upward trajectory, reflecting strong demand and tight supply.
“The suburb offers attractive investment prospects, thanks to stronger-than-average rental yields for quality homes, a high rate of owner-occupiers, and extremely low vacancy rates,” she said.
Situated between Brisbane and the Sunshine Coast, Bray Park is serviced by a direct rail link to both regions, making it ideal for commuters.
Ms Jennison said the proposed North West Transport Corridor (a preserved 9km transport corridor dating back to the 1960s) would support future connectivity and long-term growth in the suburb.
Source: PropTrack | Median price – rolling 12 months ending Nov 2025. Supply – YoY change in listings. Demand – YoY change in number of key enquiries per listing. N/A – not enough data for accurate reading. Buy Median price Annual change Supply Demand House $864,000 11% 6% 17% Unit N/A N/A N/A N/A Source: PropTrack | 10 yr price growth – change in price over past year compared to 2015. Rent – weekly median price. Vacancy rate – percentage of available rentals (filter: minimum 5 vacant properties in suburb). Gross rental yield – median percentage of a property’s value received as rental income. Invest 10 year price growth Rent Change Vacancy rate Gross yield House 126% $610 2% 0.9% 3.7% Unit N/A N/A N/A N/A N/A
Bundaberg
Population Distance to capital Main demographic 5,563 297km 30-34 years
Nominated by: Matt Lahood
Nominated for: Affordability, lifestyle, population growth and economic drivers
Known for its iconic rum, Bundaberg is tipped to see strong home price growth in 2026, as homebuyers pour into the area due to its prime location and coastal living opportunities.
There is more to the regional city’s economy than the golden, sugar cane-based liquor though, with healthy agriculture, forestry, fishing and tourism industries that provide jobs.
Around 100,000 people live in the broader Bundaberg region. Picture: realestate.com.au
The Agency’s Matt Lahood said the ongoing growth and investment in the region has seen the city’s total population increase to over 100,000 people.
“A strong prestige market has begun to emerge in Bundaberg, particularly on the coastline, with quality housing and architecturally designed homes along the coast,” he said.
“There is a strong demand from first-home buyers due to the low median house price, as well as strong employment opportunities.”
While the suburb of Bundaberg North was home to just 5,563 people at the last Census, there were 99,215 people living in the Bundaberg local government area.
As the suburb of Bundaberg only captures the commercial city centre with very few residential homes, we’ve used data from Bundaberg West to show residential price movements in the tables below.
Source: PropTrack | Median price – rolling 12 months ending Nov 2025. Supply – YoY change in listings. Demand – YoY change in number of key enquiries per listing. N/A – not enough data for accurate reading. Buy Median price Annual change Supply Demand House $543,000 5% N/A 0% Unit $450,000 18% N/A 4% Source: PropTrack | 10 yr price growth – change in price over past year compared to 2015. Rent – weekly median price. Vacancy rate – percentage of available rentals (filter: minimum 5 vacant properties in suburb). Gross rental yield – median percentage of a property’s value received as rental income. Invest 10 year price growth Rent Change Vacancy rate Gross yield House 107% $520 4% N/A 4.9% Unit 58% $385 7% N/A 4.7%
Cairns
Population Distance to capital Main demographic 3,616 1,391km 25-29 years
Nominated by: Simon Pressley
Nominated for: Amenity, population growth, investment prospects, infrastructure
Cairns is much more than a tropical destination these days, it’s a vibrant economy with plenty to offer, according to Propertyology’s Simon Pressley.
“Cairns’ economic profile now has a much thicker soup than the 1980s when tourism dominated,” Mr Pressley said.
“The James Cook university and defence forces – particularly the navy – have a major presence.”
It’s the second largest city in the top half of Australia and 16th largest overall, while its airport sees 4.7 million passengers per year, making it the country’s 7th busiest airport.
Tropical Cairns has a diverse economy beyond tourism. Picture: realestate.com.au
The regional city’s robust economy and tight housing supply have helped grow home prices by 70% over the past five years, according to Mr Pressley.
“Housing is very tight, including a rental vacancy rate which has been below 1.5% for more than five years,” he said.
“Government investment in pending stadium upgrades will create a legacy for Cairns hosting events for the 2032 Olympic Games.”
For consistency, the data below captures the CBD suburb of Cairns City which consists mostly of apartments with few freestanding houses. Census data shows there are 3,616 people living in Cairns City, though the wider Cairns area is home to more than 250,000 residents.
Source: PropTrack | Median price – rolling 12 months ending Nov 2025. Supply – YoY change in listings. Demand – YoY change in number of key enquiries per listing. N/A – not enough data for an accurate reading. Buy Median price Annual change Supply Demand House N/A N/A N/A N/A Unit $673,000 43% 8% -3% Source: PropTrack | 10 yr price growth – change in price over past year compared to 2015. Rent – weekly median price. Vacancy rate – percentage of available rentals (filter: minimum 5 vacant properties in suburb). Gross rental yield – median percentage of a property’s value received as rental income. Invest 10 year price growth Rent Change Vacancy rate Gross yield House N/A N/A N/A N/A N/A Unit 82% $595 -5% N/A 6.8%
Griffin
Population Distance to capital Main demographic 12,295 22km 30-34 years
Nominated by: Mathew Tiller
Nominated for: Family appeal, investment prospects, amenity
Griffin is a rapidly growing suburb in Brisbane’s north, known for its family-friendly vibes and proximity to North Lakes’ bustling shops and amenities.
LJ Hooker’s Mathew Tiller said the suburb’s road and rail links open up work options across Brisbane’s north and into the CBD.
“Griffin in Moreton Bay is popular with investors and young families because it balances rental demand with day‑to‑day liveability,” he said.
“Vacancy is tight, so well‑kept family homes lease quickly and yields tend to hold. New amenity in the area keeps strengthening the story.”
The suburb caters for young families in particular, with a relatively new primary school and numerous childcare centres.
Source: PropTrack | Median price – rolling 12 months ending Nov 2025. Supply – YoY change in listings. Demand – YoY change in number of key enquiries per listing. Buy Median price Annual change Supply Demand House $888,000 8% -9% -21% Unit $658,000 19% -13% -25% Source: PropTrack | 10 yr price growth – change in price over past year compared to 2015. Rent – weekly median price. Vacancy rate – percentage of available rentals (filter: minimum 5 vacant properties in suburb). Gross rental yield – median percentage of a property’s value received as rental income. Invest 10 year price growth Rent Change Vacancy rate Gross yield House 104% $675 4% 1.0% 3.8% Unit 79% $560 4% 0.8% 4.2%
Herston
Population Distance to capital Main demographic 2,311 2km 20-24 years
Nominated by: Peter Koulizos
Nominated for: Affordability, amenity, family appeal, infrastructure, investment prospects
This inner-city location is known for its healthcare and education amenities, but the suburb is set to gain global attention as the home of the future Brisbane Olympic stadium.
University of Adelaide’s Peter Koulizos said the new 63,000-seat stadium will be built in Herston’s Victoria Park for the 2032 Brisbane Olympics and Paralympic Games.
“Much of the new infrastructure for the 2032 Brisbane Olympics will be centred in and around Victoria Park, which will further improve the liveability and demand to live in this suburb,” he said.
Victoria Park is a popular spot for families with sports grounds, cycling and walking trails.
The Royal Brisbane and Women’s Hospital, Queensland Institute of Medical Research and other institutions are also located in Herston, making it an attractive spot for healthcare and research workers.
Source: PropTrack | Median price – rolling 12 months ending Nov 2025. Supply – YoY change in listings. Demand – YoY change in number of key enquiries per listing. Buy Median price Annual change Supply Demand House N/A N/A -22% 17% Unit $770,000 13% -58% 26% Source: PropTrack | 10 yr price growth – change in price over past year compared to 2015. Rent – weekly median price. Vacancy rate – percentage of available rentals (filter: minimum 5 vacant properties in suburb). Gross rental yield – median percentage of a property’s value received as rental income. N/A – not enough data for accurate reading. Invest 10 year price growth Rent Change Vacancy rate Gross yield House N/A $733 -7% 2.9% 2.1% Unit 48% $580 0% N/A 4.2%
Highfields
Population Distance to capital Main demographic 8,568 106km 15-19 years
Nominated by: Melinda Granzien
Nominated for: Family appeal, amenity, infrastructure, population growth
Families love the easy-going lifestyle on offer at Highfields, located 12km north of Toowoomba and about 106km west of Brisbane.
The location is said to have a neighbourly feel and spacious homes offering plenty of room for the kids to run around.
It has strong school options with Mary MacKillop Catholic College, Toowoomba Christian College, Highfields State School and Highfields State Secondary College.
“[This] high-amenity, family-focused suburb provides lifestyle, quality schooling, and consistent capital growth, supported by strong infrastructure and population inflows,” REBAA Queensland state representative Melinda Granzien said.
Home prices have been marching higher in the fast-growing suburb, with house prices up more than 15% to $975,000 over the past year.
Source: PropTrack | Median price – rolling 12 months ending Nov 2025. Supply – YoY change in listings. Demand – YoY change in number of key enquiries per listing. N/A – not enough data for accurate reading. Buy Median price Annual change Supply Demand House $975,000 15% 4% 8% Unit N/A N/A -50% -1% Source: PropTrack | 10 yr price growth – change in price over past year compared to 2015. Rent – weekly median price. Vacancy rate – percentage of available rentals (filter: minimum 5 vacant properties in suburb). Gross rental yield – median percentage of a property’s value received as rental income. Invest 10 year price growth Rent Change Vacancy rate Gross yield House 93% $650 0% N/A 3.8% Unit N/A $530 22% N/A 3.8%
Logan Central
Population Distance to capital Main demographic 6,356 20km 10-14 years
Nominated by: Nerida Conisbee
Nominated for: Investment prospects
Situated between Brisbane and the Gold Coast, Logan Central has benefitted from improving infrastructure and its status as an affordable entry point for investors.
Over the past 10 years, Logan Central’s median house price has climbed to $734,000, representing 146% price growth.
Ray White’s Nerida Conisbee said the area continues to attract attention from investors seeking value and future capital appreciation potential in southeast Queensland.
“High rental yields, urban renewal initiatives, and expanding transport connections have lifted its profile as a growth market,” Ms Conisbee said.
On top of its impressive investment credentials, the suburb has strong transport options with a train station and buses servicing the area.
Source: PropTrack | Median price – rolling 12 months ending Nov 2025. Supply – YoY change in listings. Demand – YoY change in number of key enquiries per listing. Buy Median price Annual change Supply Demand House $734,000 15% -15% 33% Unit $425,000 21% 15% 3% Source: PropTrack | 10 yr price growth – change in price over past year compared to 2015. Rent – weekly median price. Vacancy rate – percentage of available rentals (filter: minimum 5 vacant properties in suburb). Gross rental yield – median percentage of a property’s value received as rental income. N/A – not enough data for accurate reading. Invest 10 year price growth Rent Change Vacancy rate Gross yield House 146% $530 -2% 1.6% 4.1% Unit 131% $395 0% N/A 4.6%
Lowood
Population Distance to capital Main demographic 4,082 44km 10-14 years
Nominated by: Melinda Granzien
Nominated for: Affordability, demographic change, investment prospects
Budget-sensitive home buyers looking for larger block sizes and a semi-rural lifestyle can find it all in Lowood.
Located between Brisbane and Toowoomba, Lowood has become a popular spot since the pandemic-driven regional shift, with home buyers trading city living for a slice of country life.
According to REBAA Queensland state representative Melinda Granzien, the affordable lifestyle suburb is experiencing “tight rental conditions, new development activity, and a clear demographic shift” as young families and trades relocate from Brisbane and Ipswich.
Home prices in Lowood have soared in the past 12 months, with the median house price rising 23% to $681,000. Over the past 10 years, house prices in the area have grown 145%.
Source: PropTrack | Median price – rolling 12 months ending Nov 2025. Supply – YoY change in listings. Demand – YoY change in number of key enquiries per listing. N/A – not enough data for accurate reading. Buy Median price Annual change Supply Demand House $681,000 23% -22% 6% Unit N/A N/A N/A N/A Source: PropTrack | 10 yr price growth – change in price over past year compared to 2015. Rent – weekly median price. Vacancy rate – percentage of available rentals (filter: minimum 5 vacant properties in suburb). Gross rental yield – median percentage of a property’s value received as rental income. Invest 10 year price growth Rent Change Vacancy rate Gross yield House 145% $550 6% 2.4% 4.6% Unit N/A $460 -6% N/A 4.0%
Mackay
Population Distance to capital Main demographic 4,026 804km 20-24 years
Nominated by: John McGrath
Nominated for: Location, infrastructure, investment prospects
Mackay is not only the sugar capital of Australia, but the regional city serves as a gateway to the Whitsunday Islands and the Great Barrier Reef, offering tropical beaches and a warm climate.
Mackay has recorded double-digit price growth for both houses and units in the past 12 months. Picture: Getty
According to John McGrath, Mackay delivers a relaxed coastal lifestyle backed by a robust economy driven by mining, agriculture and tourism.
“When you add the $9 billion Bruce Highway upgrade and a major project to revitalise Mackay’s waterfront, it’s easy to see why there is increased demand for property in the region,” Mr McGrath said.
Its “buzzing arts and culture scene, pristine beaches and world class recreational fishing,” make it increasingly attractive to both home buyers and investors, he added.
While the suburb of Mackay has more than 4,000 residents, there were 121,691 people living in the wider Mackay region as of the 2021 Census.
Source: PropTrack | Median price – rolling 12 months ending Nov 2025. Supply – YoY change in listings. Demand – YoY change in number of key enquiries per listing. Buy Median price Annual change Supply Demand House $558,000 19% -19% -10% Unit $368,000 14% -18% 9% Source: PropTrack | 10 yr price growth – change in price over past year compared to 2015. Rent – weekly median price. Vacancy rate – percentage of available rentals (filter: minimum 5 vacant properties in suburb). Gross rental yield – median percentage of a property’s value received as rental income. N/A – not enough data for accurate reading. Invest 10 year price growth Rent Change Vacancy rate Gross yield House 112% $525 -9% N/A 5.5% Unit 26% $435 2% 1.1% 6.8%
Petrie
Population Distance to capital Main demographic 8,722 24km 45-49 years
Nominated by: Mathew Tiller
Nominated for: Family appeal, amenity, investment prospects
Petrie has benefitted greatly since the opening of the University of the Sunshine Coast’s long-awaited Moreton Bay campus.
The campus, which has more than 5,300 students, opened its foundation building in 2020, but completed its second phase in 2024 with new buildings, facilities, and outdoor spaces.
LJ Hooker’s Mathew Tiller said Petrie now reads less like ‘outer north Brisbane’ and more like its own hub these days.
“Petrie has been reshaped by the new university campus in Moreton Bay, which has lifted both local employment and rental demand,” he said.
“That education anchor sits alongside established rail, schools and town‑centre services.
“Owner‑occupiers like the stability and amenity, while investors like the steady tenant pool.”
The university predicts the campus will grow to 10,000 students by 2035.
Source: PropTrack | Median price – rolling 12 months ending Nov 2025. Supply – YoY change in listings. Demand – YoY change in number of key enquiries per listing. Buy Median price Annual change Supply Demand House $900,000 10% -18% 1% Unit $600,000 28% 7% 9% Source: PropTrack | 10 yr price growth – change in price over past year compared to 2015. Rent – weekly median price. Vacancy rate – percentage of available rentals (filter: minimum 5 vacant properties in suburb). Gross rental yield – median percentage of a property’s value received as rental income. N/A – not enough data for accurate reading. Invest 10 year price growth Rent Change Vacancy rate Gross yield House 126% $600 2% 1.2% 3.7% Unit 79% $508 13% N/A 3.9%
Plainland
Population Distance to capital Main demographic 1,930 60km 10-14 years
Nominated by: Melinda Granzien
Nominated for: Affordability, infrastructure, amenity, population growth, investment prospects
Head 60 kilometres west of Brisbane’s CBD and you’ll find the fast-growing rural township of Plainland in the Lockyer Valley region.
The location has served as a convenient stop for travellers along the Warrego Highway over the years, with expanding retail and service options.
But the area has become a housing hotspot in recent years amid skyrocketing demand for affordable family homes in southeast Queensland.
According to Melinda Granzien, Plainland is ideal for families and investors seeking long-term upside.
“[It’s] a rapidly developing regional hub offering affordability, major infrastructure investment, growing amenities, and strong population and employment growth,” she said.
Plainland’s median house price has soared 131% over the past 10 years.
Source: PropTrack | Median price – rolling 12 months ending Nov 2025. Supply – YoY change in listings. Demand – YoY change in number of key enquiries per listing. N/A – not enough data for accurate reading. Buy Median price Annual change Supply Demand House $787,000 9% -15% 100% Unit N/A N/A N/A N/A Source: PropTrack | 10 yr price growth – change in price over past year compared to 2015. Rent – weekly median price. Vacancy rate – percentage of available rentals (filter: minimum 5 vacant properties in suburb). Gross rental yield – median percentage of a property’s value received as rental income. Invest 10 year price growth Rent Change Vacancy rate Gross yield House 131% $660 2% 3.1% 4.2% Unit N/A N/A N/A N/A N/A
Ripley
Population Distance to capital Main demographic 12,774 32km 30-34 years
Nominated by: Mathew Tiller
Nominated for: Affordability, population growth, infrastructure, family appeal
As rising home prices in Brisbane’s middle ring push people out, more and more buyers are looking west to locations like the rapidly growing suburb of Ripley in Ipswich.
There are new homes aplenty throughout Ripley and the surrounding suburbs, which fall into the booming Ripley Valley Priority Development Area.
LJ Hooker’s Mathew Tiller said freestanding homes are still relatively accessible for first-home buyers in the suburb.
“Ripley sits in the Ipswich growth corridor and is being built out with schools, town centres and services alongside the housing,” he said.
“Population growth and staged land release are helping support ongoing activity through 2026.”
The influx of home buyers into the area has driven the suburb’s median house price 10% higher over the past year, and 132% over the past decade.
Source: PropTrack | Median price – rolling 12 months ending Nov 2025. Supply – YoY change in listings. Demand – YoY change in number of key enquiries per listing. N/A – not enough data for accurate reading. Buy Median price Annual change Supply Demand House $790,000 10% 16% 27% Unit N/A N/A N/A N/A Source: PropTrack | 10 yr price growth – change in price over past year compared to 2015. Rent – weekly median price. Vacancy rate – percentage of available rentals (filter: minimum 5 vacant properties in suburb). Gross rental yield – median percentage of a property’s value received as rental income. Invest 10 year price growth Rent Change Vacancy rate Gross yield House 132% $600 3% 2.0% 3.7% Unit N/A $503 12% N/A 3.9%
Townsville
Population Distance to capital Main demographic 2,945 1112km 25-29 years
Nominated by: Belinda Connor
Nominated for: Lifestyle, infrastructure, investment prospects, population growth
Tropical Townsville in north Queensland is known for its year‑round warm climate and access to the Great Barrier Reef and Magnetic Island.
The regional city offers a relaxed coastal lifestyle combined with a diverse economy and amenities such as universities and hospitals.
Townsville has seen home prices skyrocket as supply fails to keep up with demand. Picture: realestate.com.au
Elders’ Belinda Connor said Townville’s mix of tropical scenery, outdoor activities, and promising housing fundamentals makes it appealing to a range of buyers.
“Townsville is a prime spot for property investors thanks to its strong rental yields, low vacancy rates, and booming infrastructure – driven by growth in defence, healthcare, and renewable energy sectors,” she said.
“Townsville offers a laid-back tropical lifestyle with over 300 days of sunshine each year, making it ideal for outdoor enthusiasts to enjoy sports and nearby Magnetic Island.”
While the suburb of Townsville City is home to 2,945 people, the wider Townsville local government area has 192,768 residents, according to the 2021 Census. For consistency, the CBD suburb of Townsville City has been used for the data below.
Source: PropTrack | Median price – rolling 12 months ending Nov 2025. Supply – YoY change in listings. Demand – YoY change in number of key enquiries per listing. N/A – not enough data for accurate reading. Buy Median price Annual change Supply Demand House N/A N/A 28% -4% Unit $455,000 7% -16% 28% Source: PropTrack | 10 yr price growth – change in price over past year compared to 2015. Rent – weekly median price. Vacancy rate – percentage of available rentals (filter: minimum 5 vacant properties in suburb). Gross rental yield – median percentage of a property’s value received as rental income. Invest 10 year price growth Rent Change Vacancy rate Gross yield House N/A $540 1% N/A 4.3% Unit 6% $550 9% 1.7% 5.1%
Upper Coomera
Population Distance to capital Main demographic 27,180 50km 10-14 years
Nominated by: Mathew Tiller
Nominated for: Lifestyle, family appeal, amenity, population growth
Young families are flocking to Upper Coomera on the Gold Coast, but it’s not just for its proximity to Dreamworld and other major theme parks.
The fast-growing suburb, located 50km southeast of the Brisbane CBD, is sought after for its schools, family-friendly communities, shopping centres and its proximity to the M1 motorway, ideal for commuting to both Brisbane and the Gold Coast.
LJ Hooker’s Mathew Tiller said the suburb keeps pulling in young families who want the Gold Coast lifestyle without beachfront prices.
“Schools, shopping and quick M1 access keep local demand high from both locals and commuters,” he said.
“Turnover is steady because many buyers are trading up within the same catchment rather than leaving. Family rental demand across the northern Gold Coast remains solid.”
Source: PropTrack | Median price – rolling 12 months ending Nov 2025. Supply – YoY change in listings. Demand – YoY change in number of key enquiries per listing. Buy Median price Annual change Supply Demand House $1,021,000 12% -7% 20% Unit $752,000 9% -14% 17% Source: PropTrack | 10 yr price growth – change in price over past year compared to 2015. Rent – weekly median price. Vacancy rate – percentage of available rentals (filter: minimum 5 vacant properties in suburb). Gross rental yield – median percentage of a property’s value received as rental income. N/A – not enough data for accurate reading. Invest 10 year price growth Rent Change Vacancy rate Gross yield House 138% $780 4% 0.7% 4.1% Unit 137% $680 2% N/A 4.5%
Wavell Heights
Population Distance to capital Main demographic 10,336 8km 35-39 years
Nominated by: Melinda Jennison and Nerida Conisbee
Nominated for: Family appeal, gentrification, demographic change
Wavell Heights in Brisbane’s north has received the rare honour of a double nomination from both REBAA president Melinda Jennison and Ray White chief economist Nerida Conisbee.
It’s an attractive location, with convenient access to the city via major roads and public transport, while maintaining a quiet, suburban feel.
For Ms Conisbee, the family-friendly suburb balances leafy streets and quiet living with proximity to schools, parks, and major retail at Chermside Shopping Centre.
“It is particularly popular among established families and professionals who value safety, community, and access to quality education,” Ms Conisbee said.
Ms Jennison said Wavell Heights has become a highly sought-after suburb for families, thanks to its quality schools and strong community feel.
“The area has seen significant gentrification in recent years, with older post-war homes making way for contemporary renovations and new builds,” Ms Jennison said.
“This shift has attracted a growing number of professional families and younger buyers, contributing to a noticeable demographic change.”
Source: PropTrack | Median price – rolling 12 months ending Nov 2025. Supply – YoY change in listings. Demand – YoY change in number of key enquiries per listing. Buy Median price Annual change Supply Demand House $1,500,000 15% -3% 12% Unit $744,000 10% -38% -24% Source: PropTrack | 10 yr price growth – change in price over past year compared to 2015. Rent – weekly median price. Vacancy rate – percentage of available rentals (filter: minimum 5 vacant properties in suburb). Gross rental yield – median percentage of a property’s value received as rental income. N/A – not enough data for accurate reading. Invest 10 year price growth Rent Change Vacancy rate Gross yield House 138% $725 4% 0.6% 2.6% Unit 88% $570 10% N/A 4.1%
Yeronga
Population Distance to capital Main demographic 10,200 4km 20-24 years
Nominated by: Melinda Jennison
Nominated for: Location, amenity, infrastructure, family appeal
Yeronga offers a superb blend of lifestyle and convenience, with easy access to parks, riverfront walkways, cafes, and quality schools, making it a popular choice for both families and professionals.
According to Melinda Jennison, the suburb’s mix of amenity, location, and future investment makes it a “standout” on Brisbane’s southside.
“Just 6 kilometres from the CBD, it’s well-connected via the train line, providing quick and reliable access into the city,” Ms Jennison said.
“The suburb is also set to benefit from the Cross River Rail project, with nearby upgrades to transport infrastructure expected to improve connectivity and drive long-term growth.”
Yaronga sits along the river within 6km from Brisbane’s CBD. Picture: realestate.com.au
It has a mix of heritage homes, modern townhouses and apartments, making it an appealing location for a range of home buyers.
Yeronga’s median house price has skyrocketed by 29% over the past year, while apartment prices have jumped 11%.
Source: PropTrack | Median price – rolling 12 months ending Nov 2025. Supply – YoY change in listings. Demand – YoY change in number of key enquiries per listing. Buy Median price Annual change Supply Demand House $1,720,000 29% -1% -9% Unit $775,000 11% -15% 0% Source: PropTrack | 10 yr price growth – change in price over past year compared to 2015. Rent – weekly median price. Vacancy rate – percentage of available rentals (filter: minimum 5 vacant properties in suburb). Gross rental yield – median percentage of a property’s value received as rental income. Invest 10 year price growth Rent Change Vacancy rate Gross yield House 137% $750 7% 1.7% 3.0% Unit 58% $570 -2% 0.7% 3.5%
Jump back to the top
South Australia
Of the nine SA nominations in this year’s Hot 100, just two were located outside the capital city. Affordability was the main theme as rapidly rising home prices across the state put pressure on those trying to crack into the market for the first time.
Brooklyn Park
Population Distance to capital Main demographic 5,040 5km 25-29 years
Nominated by: Peter Koulizos
Nominated for: Affordability, amenity, family appeal, location, investment prospects, infrastructure
Home buyers looking to live between the city and the sea in Adelaide should take a good look at Brooklyn Park.
The suburb is just five kilometres from both the Adelaide CBD and Henley Beach, with lifestyle amenities such as craft breweries, cellar doors and gyms popping up throughout the area.
An added bonus is that the median house price in Brooklyn Park ($990,000) is significantly cheaper than the neighbouring suburb of Lockleys ($1.4 million).
University of Adelaide’s Peter Koulizos says the suburb’s proximity to the city and neighbouring prime suburbs offers good capital growth prospects for home buyers.
He also highlighted the suburb’s proximity to the Adelaide airport, which is undergoing a $600 million redevelopment set to boost the infrastructure in the area.
“The major redevelopment of the airport will create many long-term jobs, which will attract more demand for people to live in this suburb, therefore pushing up prices and rents,” he said.
Source: PropTrack | Median price – rolling 12 months ending Nov 2025. Supply – YoY change in listings. Demand – YoY change in number of key enquiries per listing. Buy Median price Annual change Supply Demand House $990,000 8% -26% -8% Unit $465,000 23% 31% -14% Source: PropTrack | 10 yr price growth – change in price over past year compared to 2015. Rent – weekly median price. Vacancy rate – percentage of available rentals (filter: minimum 5 vacant properties in suburb). Gross rental yield – median percentage of a property’s value received as rental income. N/A – not enough data for accurate reading. Invest 10 year price growth Rent Change Vacancy rate Gross yield House 111% $620 -4% 2.1% 3.2% Unit 109% $450 7% N/A 4.3%
Brompton
Population Distance to capital Main demographic 3,729 4km 25-29 years
Nominated by: Matt O’Donoghue
Nominated for: Affordability, amenity, gentrification and population growth
Younger residents have been moving into Adelaide’s inner-city suburb of Brompton, just four kilometres north of the city centre, but a major new project is set to accelerate that trend.
The site of the former Brompton Gasworks in the suburb has been unlocked for 800 new homes, a hotel, retail and new public space after authorities completed one of the most complex soil remediation projects in the state’s history in October.
It’s a big move for an inner-city suburb that had 1,788 private homes in 2021, according to the most recent census.
REBAA SA state representative Matt O’Donoghue said Brompton is a well-located, affordable suburb with excellent access to cafés, restaurants, and public transport.
“Its mix of early 20th-century homes and modern townhouses caters to families and professionals alike,” Mr O’Donoghue said.
“Significant gentrification over the past decade has reshaped its demographic, drawing in younger residents and boosting population growth.
“Brompton now stands as a vibrant, in-demand suburb with strong community appeal.”
Source: PropTrack | Median price – rolling 12 months ending Nov 2025. Supply – YoY change in listings. Demand – YoY change in number of key enquiries per listing. Buy Median price Annual change Supply Demand House $865,000 9% -29% -19% Unit $703,000 0% -25% -13% Source: PropTrack | 10 yr price growth – change in price over past year compared to 2015. Rent – weekly median price. Vacancy rate – percentage of available rentals (filter: minimum 5 vacant properties in suburb). Gross rental yield – median percentage of a property’s value received as rental income. N/A – not enough data for accurate reading. Invest 10 year price growth Rent Change Vacancy rate Gross yield House 79% $650 2% N/A 3.5% Unit 73% $625 6% N/A 4.2%
Elizabeth North
Population Distance to capital Main demographic 3,588 27km 25-29 years
Nominated by: Nerida Conisbee
Nominated for: Affordability
Home prices in Elizabeth North have more than tripled over the past decade, but it still remains one of Adelaide’s most affordable suburbs.
Ray White chief economist Nerida Conisbee said the area’s appeal lies in its generous block sizes, older yet solid housing stock, and improving transport links to the city.
“Elizabeth North continues to attract first-home buyers and budget-conscious purchasers who appreciate its relative value compared with other parts of metropolitan Adelaide,” Ms Conisbee said, adding the median house price was less than $200,000 a decade ago according to Neoval.
The recent PropTrack Terri Scheer Investor Report ranked Elizabeth North second in Adelaide among the top performing investor areas of the past year. It found growth was higher in Elizabeth North than the capital city average, while rental yields were stronger and homes lease quickly.
Source: PropTrack | Median price – rolling 12 months ending Nov 2025. Supply – YoY change in listings. Demand – YoY change in number of key enquiries per listing. N/A – not enough data for accurate reading. Buy Median price Annual change Supply Demand House $510,000 16% -10% -16% Unit N/A N/A N/A N/A Source: PropTrack | 10 yr price growth – change in price over past year compared to 2015. Rent – weekly median price. Vacancy rate – percentage of available rentals (filter: minimum 5 vacant properties in suburb). Gross rental yield – median percentage of a property’s value received as rental income. Invest 10 year price growth Rent Change Vacancy rate Gross yield House 237% $440 -2% 2.4% 4.6% Unit N/A $300 9% N/A 4.8%
Murray Bridge
Population Distance to capital Main demographic 18,243 65km 60-64 years
Nominated by: Belinda Connor
Nominated for: Affordability, investment prospects
As the name suggests, Murray Bridge sits on the banks of the Murray River about an hour southeast of Adelaide.
Not only is it one of South Australia’s fastest growing regional centres, but it’s also had some of the strongest price growth in the state, with house prices more than doubling in the past five years.
Murray Bridge is attracting young families, retirees and tree-changers. Picture: realestate.com.au
Despite this growth, homes remain affordable which Belinda Connor said is attracting a wave of young families, retirees and those seeking a riverside lifestyle – all within easy reach of the capital.
“With ongoing infrastructure projects and commercial investment, expanding amenities, and strong rental demand, Murray Bridge is transforming into a key regional growth hub, appealing to buyers seeking an affordable family home with solid long-term investment potential,” Ms Connor said.
Source: PropTrack | Median price – rolling 12 months ending Nov 2025. Supply – YoY change in listings. Demand – YoY change in number of key enquiries per listing. N/A – not enough data for accurate reading. Buy Median price Annual change Supply Demand House $545,000 17% -8% 18% Unit $403,000 9% N/A N/A Source: PropTrack | 10 yr price growth – change in price over past year compared to 2015. Rent – weekly median price. Vacancy rate – percentage of available rentals (filter: minimum 5 vacant properties in suburb). Gross rental yield – median percentage of a property’s value received as rental income. Invest 10 year price growth Rent Change Vacancy rate Gross yield House 138% $480 7% 2.6% 4.5% Unit 125% $360 6% N/A 4.0%
Old Noarlunga
Population Distance to capital Main demographic 1,531 29km 45-49 years
Nominated by: Peter Koulizos
Nominated for: Affordability, amenity, family appeal, location
Sitting in a picturesque pocket surrounded by riverland and just moments from the McLaren Vale wine region, Old Noarlunga feels a world away from the hustle and bustle of Adelaide – and that’s because it once was, according to Peter Koulizos.
“[It] used to be a small country town but the Adelaide metropolitan area has grown so much that it is now considered to be in the greater Adelaide region,” Mr Koulizos said.
“However, it has retained its lovely village feel. The Onkaparinga River runs through Old Noarlunga, providing a lovely setting for those who wish to picnic on its banks or paddle on the river.”
Despite one of the strongest annual growth rates in the country, Mr Koulizos said house prices remain well below that of metropolitan Adelaide.
The Onkaparinga River runs through Old Noarlunga. Picture: realestate.com.au
The suburb is predominantly made up of single level detached houses, which attract many families, he added. With so few apartments and attached dwellings in the suburb, there was insufficient sales data to include any unit stats in the tables below.
Source: PropTrack | Median price – rolling 12 months ending Nov 2025. Supply – YoY change in listings. Demand – YoY change in number of key enquiries per listing. N/A – not enough data for accurate reading Buy Median price Annual change Supply Demand House $856,000 27% 9% 15% Unit N/A N/A N/A N/A Source: PropTrack | 10 yr price growth – change in price over past year compared to 2015. Rent – weekly median price. Vacancy rate – percentage of available rentals (filter: minimum 5 vacant properties in suburb). Gross rental yield – median percentage of a property’s value received as rental income. Invest 10 year price growth Rent Change Vacancy rate Gross yield House 141% $625 12% N/A 3.8% Unit N/A N/A N/A N/A N/A
Ovingham
Population Distance to capital Main demographic 766 4.1km 25-39
Nominated by: Matt O’Donoghue
Nominated for: Location, affordability
Situated on the northern fringe of Adelaide’s CBD, Ovingham is a small, inner-city gem combining green spaces, amenities and transport at a much more affordable price than its ultra-posh southern neighbour, North Adelaide.
Matt O’Donoghue said the suburb combines “heritage charm with modern conveniences” thanks to its interesting mix of renovated cottages and new builds.
“Ongoing gentrification and steady population growth have strengthened its appeal, particularly among younger buyers looking for value and lifestyle,” Mr O’Donoghue said.
“The suburb benefits from its proximity to the North Adelaide Golf Course and upcoming upgrades to Park Terrace.”
Ovingham sits near key bus and tram routes and has its own train station. It’s location close to the River Torrens Linear Park means residents have an abundance of opportunities for cycling, walking, and outdoor recreation, while nearby North Adelaide, Hindmarsh, and Bowden mean cafes, pubs, restaurants, gyms, shopping, and services are also close at hand.
Source: PropTrack | Median price – rolling 12 months ending Nov 2025. Supply – YoY change in listings. Demand – YoY change in number of key enquiries per listing. N/A – not enough data for accurate reading Buy Median price Annual change Supply Demand House $1,005,000 41% N/A N/A Unit N/A N/A N/A N/A Source: PropTrack | 10 yr price growth – change in price over past year compared to 2015. Rent – weekly median price. Vacancy rate – percentage of available rentals (filter: minimum 5 vacant properties in suburb). Gross rental yield – median percentage of a property’s value received as rental income. Invest 10 year price growth Rent Change Vacancy rate Gross yield House 90% $625 9% N/A 3.1% Unit N/A $395 -10% N/A 4.1%
Port Adelaide
Population Distance to capital Main demographic 1,338 13.34km 60-64
Nominated by: Mathew Tiller
Nominated for: Gentrification, investment prospects
Located in Adelaide’s northern suburbs and with great proximity to the coast, Port Adelaide has made this year’s list thanks to its impressive evolution into a vibrant, community-oriented place to call home.
“Port Adelaide has moved from pure port to a mixed waterfront precinct, with bars, cafés and heritage buildings now part of the pitch,” Mathew Tiller said.
“It attracts buyers who like character and employment access in the same postcode.”
Port Adelaide is in the process of gentrification. Picture: getty
Retail and hospitality upgrades have helped shift the area’s reputation, with plenty of further upside ahead, he added.
“Investors are watching tight rental conditions and the sense that the story still has room to run.”
Source: PropTrack | Median price – rolling 12 months ending Nov 2025. Supply – YoY change in listings. Demand – YoY change in number of key enquiries per listing. Buy Median price Annual change Supply Demand House $719,000 7% -16% 26% Unit $603,000 45% -7% 16% Source: PropTrack | 10 yr price growth – change in price over past year compared to 2015. Rent – weekly median price. Vacancy rate – percentage of available rentals (filter: minimum 5 vacant properties in suburb). Gross rental yield – median percentage of a property’s value received as rental income. N/A – not enough data for accurate reading Invest 10 year price growth Rent Change Vacancy rate Gross yield House 54% $640 7% 2.5% 3.9% Unit N/A $485 -3% N/A 4.0%
Renmark
Population Distance to capital Main demographic 4,705 214km 65-69
Nominated by: Belinda Connor
Nominated for: Affordability, family appeal
Renmark is a rural town on the Murray River in South Australia’s Riverland region that has plenty of potential, according to Belinda Connor.
“Offering exceptional affordability and a strong family-friendly lifestyle, Renmark is seeing renewed investment and population growth, with young families drawn to its riverfront amenity, good schools, and emerging local dining scene,” she said.
The region is known as a major food bowl for its cultivation of produce such as grapes, citrus fruits, almonds and olive oil, and the food and horticulture industries are big employers.
Houses range from weatherboard cottages to modern family homes, and while prices rose 14% in the past year, the median price of $436,000 makes it an affordable option.
Source: PropTrack | Median price – rolling 12 months ending Nov 2025. Supply – YoY change in listings. Demand – YoY change in number of key enquiries per listing. N/A – not enough data for accurate reading. Buy Median price Annual change Supply Demand House $436,000 14% 11% 42% Unit N/A N/A N/A N/A Source: PropTrack | 10 yr price growth – change in price over past year compared to 2015. Rent – weekly median price. Vacancy rate – percentage of available rentals (filter: minimum 5 vacant properties in suburb). Gross rental yield – median percentage of a property’s value received as rental income. Invest 10 year price growth Rent Change Vacancy rate Gross yield House 118% $408 4% N/A 5.7% Unit N/A $305 9% N/A 3.9%
Southwark
Population Distance to capital Main demographic N/A 3km N/A
Nominated by: Matt O’Donoghue
Nominated for: Location, gentrification
Adelaide’s newest suburb has a long history dating back to the late 1800s.
Originally subdivided in 1881, Southwark has historically formed part of Thebarton, and for 135 years was dominated by the West End Brewery, which closed in 2021.
The new suburb will be carved out Thebarton’s northeast corner, encompassing the former brewery site as well as several blocks to the south and west.
The brewery is undergoing a major $1 billion redevelopment, with up to 1300 new homes planned in the residential and commercial precinct, including 20% designated as affordable housing. The first release of 17 townhouses are already on the market.
More than 15% of the site will be public open space, and the master plan includes a tree canopy target of 30%.
Matt O’Donoghue said the suburb’s proximity to major hospitals and transport links positioned it as a key growth area.
“Designed for modern, urban living, Southwark is expected to ease rental pressure while offering strong investment appeal and lifestyle benefits,” he said.
As the suburb is brand new, there is no property sales data to include in the tables below and it’s yet to be included in the Census.
Source: PropTrack | Median price – rolling 12 months ending Nov 2025. Supply – YoY change in listings. Demand – YoY change in number of key enquiries per listing. N/A – not enough data for accurate reading. Buy Median price Annual change Supply Demand House N/A N/A N/A N/A Unit N/A N/A N/A N/A Source: PropTrack | 10 yr price growth – change in price over past year compared to 2015. Rent – weekly median price. Vacancy rate – percentage of available rentals (filter: minimum 5 vacant properties in suburb). Gross rental yield – median percentage of a property’s value received as rental income. Invest 10 year price growth Rent Change Vacancy rate Gross yield House N/A N/A N/A N/A N/A Unit N/A N/A N/A N/A N/A
Jump back to the top
Western Australia
The nine nominations across WA are expected to continue on an upward trajectory in 2026, having already seen very strong price growth over the past 12 months. Every single pick has recorded double digit annual price growth for either houses or units – some across both.
There are just two regional locations with the rest spread across the capital city.
Albany
Population Distance to capital Main demographic 38,763 390km 55-59 years
Nominated by Simon Pressley
Nominated for: Amenity, population growth, investment prospects
On the southern tip of Western Australia, Albany is famed for its rugged coast, rich heritage and award‑winning wineries.
As WA’s oldest port city, it blends tourism and maritime trade with a stable local economy.
Low stock and strong buyer demand could see Albany outperform the rest of the state in 2026. Picture: Getty
According to Propertyology, it could be the state’s top property performer in 2026.
“With a population of 41,000, this West Australian port city is bigger than NSW’s Byron and Victoria’s Surf Coast. Albany’s homeownership rate of 79% is higher than all eight capital cities,” Propertyology’s head of research Simon Pressley said.
“High local confidence is driving Albany’s strong demand for housing. Owner-occupiers and property investors are forced to compete hard for low housing supply, which is currently 40% less than this time three years ago.”
Alongside its lifestyle appeal, Albany’s recent upgrades to health facilities, a growing arts festival scene, and proximity to Stirling Range National Park give it a well‑rounded draw.
Source: PropTrack | Median price – rolling 12 months ending Nov 2025. Supply – YoY change in listings. Demand – YoY change in number of key enquiries per listing. N/A – not enough data for accurate reading Buy Median price Annual change Supply Demand House $903,000 10% -22% -18% Unit N/A N/A N/A N/A Source: PropTrack | 10 yr price growth – change in price over past year compared to 2015. Rent – weekly median price. Vacancy rate – percentage of available rentals (filter: minimum 5 vacant properties in suburb). Gross rental yield – median percentage of a property’s value received as rental income. Invest 10 year price growth Rent Change Vacancy rate Gross yield House 25% $550 -5% N/A 3.8% Unit N/A N/A N/A N/A N/A
Alkimos
Population Distance to capital Main demographic 10,203 41km 30-34 years
Nominated by: Matthew Tiller
Nominated for: Affordability, infrastructure, family appeal
Located on the northern edge of Perth, Alkimos is in the spotlight thanks to the completion of the Yanchep railway extension. This brings direct access to the Joondalup line and shorter CBD commutes.
While it’s still a fair trek from the city centre, it offers everything a buyer could want – relatively affordable homes on big blocks, decent commutability, wide beaches and parklands.
“Young families are targeting the area for modern homes close to schools, parks and the water,” LJ Hooker head of research Matthew Tiller said.
“Prices are still well below Perth’s inner coastal suburbs. With transport improvements now delivered, Alkimos is firmly on buyer shortlists.”
Beyond lifestyle, future growth is supported by planned retail expansions, nearby employment opportunities in the northern growth corridor, and steady demand from renters seeking affordable coastal living.
Source: PropTrack | Median price – rolling 12 months ending Nov 2025. Supply – YoY change in listings. Demand – YoY change in number of key enquiries per listing. Buy Median price Annual change Supply Demand House $730,000 9% -2% 0% Unit $625,000 18% 0% 7% Source: PropTrack | 10 yr price growth – change in price over past year compared to 2015. Rent – weekly median price. Vacancy rate – percentage of available rentals (filter: minimum 5 vacant properties in suburb). Gross rental yield – median percentage of a property’s value received as rental income. N/A – not enough data for accurate reading. Invest 10 year price growth Rent Change Vacancy rate Gross yield House 51% $680 5% 1.4% 4.5% Unit 47% $640 16% N/A 4.8%
Applecross
Population Distance to capital Main demographic 7,228 7km 65-69 years
Nominated by: Matt Lahood
Nominated for: Location, amenity
Set along the Swan River waterfront, Applecross offers prestige property in leafy streets known for their jacaranda blooms.
A strong local café, restaurant and retail scene complements the serene river views and easy CBD access.
“While it has seen large gains in recent years there is still more growth expected as the suburb continues to mature,” The Agency’s Matt Lahood said.
Applecross is a prestige suburb with an older demographic. Picture: realestate.com.au
Given its blend of heritage character and modern luxury, it continues to be a benchmark for high‑end living in Perth’s property market, with many new developments also popping up in the area.
The City of Melville Council is also investing in the suburb’s amenities with the Moreau Mews Town Square set to become a public open space filled with a BBQ area, green areas and open space for community events.
Source: PropTrack | Median price – rolling 12 months ending Nov 2025. Supply – YoY change in listings. Demand – YoY change in number of key enquiries per listing. Buy Median price Annual change Supply Demand House $3,000,000 15% -11% 27% Unit $1,082,000 42% 7% -20% Source: PropTrack | 10 yr price growth – change in price over past year compared to 2015. Rent – weekly median price. Vacancy rate – percentage of available rentals (filter: minimum 5 vacant properties in suburb). Gross rental yield – median percentage of a property’s value received as rental income. Invest 10 year price growth Rent Change Vacancy rate Gross yield House 95% $1,000 1% 1.8% 2.3% Unit 50% $755 8% 2.7% 4.3%
Baldivis
Population Distance to capital Main demographic 37,697 41km 30-34 years
Nominated by: Nerida Conisbee and Mathew Tiller
Nominated for: Affordability, family appeal, demographic change, investment prospects
Baldivis in Perth’s south‑west corridor has evolved from a semi‑rural town into one of the city’s fastest‑growing family neighbourhoods.
“Younger families have increasingly replaced older residents, shifting the suburb’s demographic profile,” Ray White’s Nerida Conisbee said.
“Affordable new housing estates, local schooling options, and easy access to the freeway network continue to drive demand and reshape the community’s character.”
LJ Hooker’s Mathew Tiller added that owner-occupier depth creates stability when investors are quiet.
“That stability has made Baldivis a consistent performer in Perth’s south‑west corridor,” he said. “The value story is simple: more house and more land for less money than the inner city.”
Part of the City of Rockingham, Baldivis also benefits from expanding retail centres, nearby industrial employment hubs and planned community infrastructure.
Source: PropTrack | Median price – rolling 12 months ending Nov 2025. Supply – YoY change in listings. Demand – YoY change in number of key enquiries per listing. Buy Median price Annual change Supply Demand House $710,000 5% 1% -6% Unit $558,000 24% 14% 10% Source: PropTrack | 10 yr price growth – change in price over past year compared to 2015. Rent – weekly median price. Vacancy rate – percentage of available rentals (filter: minimum 5 vacant properties in suburb). Gross rental yield – median percentage of a property’s value received as rental income. N/A – not enough data for accurate reading. Invest 10 year price growth Rent Change Vacancy rate Gross yield House 56% $650 3% 1.6% 4.2% Unit 47% $525 1% N/A 5.1%
Carlisle
Population Distance to capital Main demographic 6,733 6km 30-34 years
Nominated by: Peter Gavalas
Nominated for: Affordability, infrastructure, amenity, location, investment prospects
Located six kilometres east of Perth’s CBD, Carlisle is seeing strong interest after transport and infrastructure upgrades, including railway improvements and level crossing removals.
Its location offers easy access to local schools, the Swan River, the airport and East Victoria Park’s cafe strip.
REBBA WA state representative Peter Gavalas said the suburb’s competitive median price compared to neighbouring suburbs – such as Lathlain and East Victoria Park – make it an attractive option for buyers.
“With a mixture of medium‑density development and houses, it suits first-home buyers, families and downsizers,” Mr Gavalas said.
The proposed Perth Airport upgrade over the next five years is also expected to bring more local economic activity, Mr Gavalas said, making this pocket one to watch.
Source: PropTrack | Median price – rolling 12 months ending Nov 2025. Supply – YoY change in listings. Demand – YoY change in number of key enquiries per listing. Buy Median price Annual change Supply Demand House $900,000 22% -3% 8% Unit $783,000 25% 7% 2% Source: PropTrack | 10 yr price growth – change in price over past year compared to 2015. Rent – weekly median price. Vacancy rate – percentage of available rentals (filter: minimum 5 vacant properties in suburb). Gross rental yield – median percentage of a property’s value received as rental income. N/A – not enough data for accurate reading. Invest 10 year price growth Rent Change Vacancy rate Gross yield House 58% $740 10% N/A 4.3% Unit 63% $670 3% N/A 5.4%
Ellenbrook
Population Distance to capital Main demographic 24,668 22km 5-9 years
Nominated by: Mathew Tiller
Nominated for: Affordability, infrastructure, family appeal, amenity
Ellenbrook’s image has shifted thanks to a long-awaited rail extension (which opened last year), connecting the suburb to Perth’s CBD in about 30 minutes.
That’s lifted the suburb from “too far out” to properly connected, according to LJ Hooker’s Mathew Tiller.
“It already had schools, shopping and community services, and transport was the missing piece,” Mr Tiller said.
“That shift has lifted confidence for both first-home buyers and investors chasing rental demand. The result is solid interest at price points still below inner‑metro Perth.”
New transport access is expected to fuel further development in neighbouring suburbs, while existing community events, sports facilities and Swan Valley wineries nearby add lifestyle perks.
Source: PropTrack | Median price – rolling 12 months ending Nov 2025. Supply – YoY change in listings. Demand – YoY change in number of key enquiries per listing. Buy Median price Annual change Supply Demand House $725,000 12% -13% -4% Unit $480,000 7% -2% -30% Source: PropTrack | 10 yr price growth – change in price over past year compared to 2015. Rent – weekly median price. Vacancy rate – percentage of available rentals (filter: minimum 5 vacant properties in suburb). Gross rental yield – median percentage of a property’s value received as rental income. N/A – not enough data for accurate reading. Invest 10 year price growth Rent Change Vacancy rate Gross yield House 69% $690 5% 2.1% 4.7% Unit 26% $550 0% N/A 5.4%
Nollamara
Population Distance to capital Main demographic 12,779 8km 30-34 years
Nominated by: Peter Gavalas
Nominated for: Affordability, location, amenity, investment prospects
Eight kilometres from both Perth’s CBD and the coast, Nollamara offers value near more expensive neighbours Yokine and Dianella.
Located in the City of Stirling, it has quick access to Wanneroo Road, Reid Highway and the Malaga employment hub, which is the City of Swan’s largest employment area and second-largest industrial centre in WA.
“Nollamara offers a diverse range of dwelling types in units and houses, with some great options for first-home buyers, downsizers and families,” Mr Gavalas said.
“Most of the suburb is zoned for medium density development and will provide demand for the larger lots from developers and investors in the future.”
It also has several public recreation areas, community centres and schools, making it appealing for families.
Source: PropTrack | Median price – rolling 12 months ending Nov 2025. Supply – YoY change in listings. Demand – YoY change in number of key enquiries per listing. Buy Median price Annual change Supply Demand House $700,000 10% 4% -6% Unit $600,000 24% -28% -20% Source: PropTrack | 10 yr price growth – change in price over past year compared to 2015. Rent – weekly median price. Vacancy rate – percentage of available rentals (filter: minimum 5 vacant properties in suburb). Gross rental yield – median percentage of a property’s value received as rental income. N/A – not enough data for accurate reading. Invest 10 year price growth Rent Change Vacancy rate Gross yield House 52% $700 8% 0.7% 4.7% Unit 60% $650 12% N/A 5.2%
Rockingham
Population Distance to capital Main demographic 15,312 38km 50-54 years
Nominated by: Belinda Conner
Nominated for: Affordability, amenity, infrastructure, population growth, investment prospects
Rockingham offers coastal living at prices lower than many Perth‑adjacent beach suburbs, according to Belinda Conner.
Ms Conner said it combines coastal affordability with a growing reputation as a lifestyle and investment hub.
“Its beaches, cafes and family-friendly amenities attract steady population growth and new buyers,” Ms Conner said.
“With major AUKUS-related defence investment boosting local jobs and infrastructure, the suburb’s future value and appeal are set to strengthen.”
The suburb also benefits from strong tourism trade, sailing and marine recreation, plus good commuting links to the Kwinana industrial area and Perth via the freeway and rail.
Source: PropTrack | Median price – rolling 12 months ending Nov 2025. Supply – YoY change in listings. Demand – YoY change in number of key enquiries per listing. Buy Median price Annual change Supply Demand House $760,000 15% -6% -8% Unit $485,000 14% -9% 13% Source: PropTrack | 10 yr price growth – change in price over past year compared to 2015. Rent – weekly median price. Vacancy rate – percentage of available rentals (filter: minimum 5 vacant properties in suburb). Gross rental yield – median percentage of a property’s value received as rental income. Invest 10 year price growth Rent Change Vacancy rate Gross yield House 65% $600 4% 1.4% 4.3% Unit 39% $538 8% 1.9% 5.5%
South Bunbury
Population Distance to capital Main demographic 12,760 157km 60-64 years
Nominated by: Belinda Conner
Nominated for: Affordability, family appeal, amenity, infrastructure, population growth
Nestled along WA’s coastline around two hours south of Perth, South Bunbury’s beaches, schools and recreational facilities are supporting strong buyer demand.
Belinda Conner said the city of Bunbury is often referred to as WA’s “second city” because it serves as the economic and service hub for the state’s southwest region.
“Ongoing infrastructure growth and demographic change are driving fresh investment and steady long-term value,” Ms Connor said.
Bunbury is often referred to as WA’s ‘second city’. Picture: Getty
The suburb’s well‑established community networks, access to regional jobs, and proximity to the pristine Leschenault Inlet – a water lover’s paradise – add to its appeal.
Ongoing upgrades to roads and sporting facilities, making it attractive for a mix of buyers from families to downsizers and investors.
The broader city of Bunbury was also nominated by The Agency’s Matt Lahood, who said the area is growing in popularity as a regional alternative to Perth due to its more affordable pricing. It has large mining and mineral processing facilities, and the AFL hosting a match in the area and commitment to more games is helping support growth.
Source: PropTrack | Median price – rolling 12 months ending Nov 2025. Supply – YoY change in listings. Demand – YoY change in number of key enquiries per listing. Buy Median price Annual change Supply Demand House $700,000 8% 32% -18% Unit $525,000 12% -3% -7% Source: PropTrack | 10 yr price growth – change in price over past year compared to 2015. Rent – weekly median price. Vacancy rate – percentage of available rentals (filter: minimum 5 vacant properties in suburb). Gross rental yield – median percentage of a property’s value received as rental income. N/A – not enough data for accurate reading. Invest 10 year price growth Rent Change Vacancy rate Gross yield House 67% $600 9% N/A 4.4% Unit 64% $580 9% N/A 5.5%
Jump back to the top
Australian Capital Territory
The nation’s capital received five nominations in this year’s list, with a strong theme for family friendly suburbs offering larger homes on oversized blocks.
Bonython
Population Distance to capital Main demographic 3,839 18km 50-54
Nominated by: Mathew Tiller
Nominated for: Investment potential
Situated in Canberra’s southwest, Bonython’s allure lies in its combination of natural beauty and convenience.
It’s right on the Murrumbidgee river, with access to walking tracks and expansive green spaces.
But it’s also next to the Tuggeranong town centre, which provides shops, services and transport close by.
Housing in the tightly-held suburb includes a mix of freestanding houses on quiet streets and low-maintenance townhouses.
LJ Hooker’s Mathew Tiller said strong demand from renters could make Bonython a good option for investors.
“Low rental vacancy and steady day‑to‑day amenity have supported values,” he said.
“It’s seen as a practical, good‑value alternative to Canberra’s inner south and inner north.”
Source: PropTrack | Median price – rolling 12 months ending Nov 2025. Supply – YoY change in listings. Demand – YoY change in number of key enquiries per listing. Buy Median price Annual change Supply Demand House $880,000 -2% -20% 57% Unit $708,000 -2% 23% -13% Source: PropTrack | 10 yr price growth – change in price over past year compared to 2015. Rent – weekly median price. Vacancy rate – percentage of available rentals (filter: minimum 5 vacant properties in suburb). Gross rental yield – median percentage of a property’s value received as rental income. N/A – not enough data for accurate reading. Invest 10 year price growth Rent Change Vacancy rate Gross yield House 76% $720 11% NA 4% Unit 72% $610 2% NA 4.3%
Denman Prospect
Population Distance to capital Main demographic 2,759 10km 35-39
Nominated by Mathew Tiller
Nominated for: Family appeal, amenity
Denman Prospect is one of Canberra’s newest suburbs, situated in the Molonglo Valley, a growth corridor in the city’s west, about 20 minutes’ drive from the city.
As such, part of its appeal is the new housing stock on offer – typically large, high-quality homes, Mathew Tiller said.
“It appeals to families who want a high‑spec modern home without going through a full custom build,” he said.
Denman Prospect is a growth corridor in Canberra’s west. Picture: realestate.com.au
It’s also close to the cycling and running tracks of Stromlo Forest Park as well as Stromlo Leisure Centre, allowing easy access to recreation.
“Views, green space and improving local amenity are a big part of the pitch,” Mr Tiller said.
Denman Village shopping centre caters to a growing population, with further housing expansion underway in the north of the suburb.
Source: PropTrack | Median price – rolling 12 months ending Nov 2025. Supply – YoY change in listings. Demand – YoY change in number of key enquiries per listing. Buy Median price Annual change Supply Demand House $1,289,000 -7% 40% 14% Unit $585,000 0% 38% 43% Source: PropTrack | 10 yr price growth – change in price over past year compared to 2015. Rent – weekly median price. Vacancy rate – percentage of available rentals (filter: minimum 5 vacant properties in suburb). Gross rental yield – median percentage of a property’s value received as rental income. N/A – not enough data for accurate reading. Invest 10 year price growth Rent Change Vacancy rate Gross yield House NA $968 8% NA 3.2% Unit NA $600 3% 3.6% 5.7%
Giralang
Population Distance to capital Main demographic 3,372 8km 35-39
Nominated by Mathew Tiller
Nominated for: Family appeal
An established suburb in Canberra’s north, Giralang appeals to upsizing families and downsizers, with homes typically more affordable than inner north suburb closer to the city.
It’s positioned about 20 minutes’ drive from the CBD and 10 minutes from Belconnen, which provides essential amenities within easy reach.
Most homes in the leafy suburb date to the 1970s, offering scope for adding value by renovating.
“Stock on market is usually tight, which has helped support prices even when the broader market cools,” Mathew Tiller said.
“Buyers like that it’s quiet, practical and still well connected.”
Buy Median price Annual change Supply Demand House $885,000 -3% 9% -19% Unit $765,000 9% NA 25%
Source: PropTrack | Median price – rolling 12 months ending Nov 2025. Supply – YoY change in listings. Demand – YoY change in number of key enquiries per listing.
Invest 10 year price growth Rent Change Vacancy rate Gross yield House 61% $670 4% NA 3.7% Unit NA $650 5% NA 4.8%
Source: PropTrack | 10 yr price growth – change in price over past year compared to 2015. Rent – weekly median price. Vacancy rate – percentage of available rentals (filter: minimum 5 vacant properties in suburb). Gross rental yield – median percentage of a property’s value received as rental income. N/A – not enough data for accurate reading.
Melba
Population Distance to capital Main demographic 3,383 10.5km 35-39
Nominated by: Claire Corby
Nominated for: Affordability, family appeal
Melba is a hidden gem within Canberra’s Belconnen district that families will love, according to Claire Corby.
“Melba offers that rare trifecta for families: relative affordability, bigger backyards that invite time away from screens, and walkable distance to public schooling at all three levels,” she said.
Most houses are freestanding and owner-occupied, with a mix of original 1970s and 1980s homes and renovated properties.
The suburb has a small set of local shops but is just a 10-minute drive to Belconnen town centre where shoppers will find supermarkets, department stores and specialty retailers.
Bike tracks, walking trails and parklands boost the suburb’s appeal, as do views thanks to its varied topography.
“The elevated views from streets backing Mount Rogers are some of the best in the city.”
Source: PropTrack | Median price – rolling 12 months ending Nov 2025. Supply – YoY change in listings. Demand – YoY change in number of key enquiries per listing. N/A – not enough data for accurate reading. Buy Median price Annual change Supply Demand House $891,000 1% -8% -26% Unit NA NA -9% 39% Source: PropTrack | 10 yr price growth – change in price over past year compared to 2015. Rent – weekly median price. Vacancy rate – percentage of available rentals (filter: minimum 5 vacant properties in suburb). Gross rental yield – median percentage of a property’s value received as rental income. Invest 10 year price growth Rent Change Vacancy rate Gross yield House 76% $680 12% NA 4.0% Unit NA NA NA NA NA
O’Connor
Population Distance to capital Main demographic 5,917 3km 20-24
Nominated by Claire Corby
Nominated for: Gentrification, demographic change
O’Connor’s proximity to both the city and ANU is one of its major drawcards, attracting professionals and academics.
While parts of the suburb are heritage listed, in other areas older homes are making way for new builds taking advantage of oversized blocks, according to Claire Corby.
“It’s difficult to drive down any street in O’Connor and not find at least one new home under construction,” she said.
The leafy, established suburb is at the pricier end of the market, with buyers willing to pay a premium for the location.
“Despite its proximity to Civic, it feels peaceful and lush thanks to the grand trees that line the streets,” Ms Corby said.
Source: PropTrack | Median price – rolling 12 months ending Nov 2025. Supply – YoY change in listings. Demand – YoY change in number of key enquiries per listing. Buy Median price Annual change Supply Demand House $1,609,000 15% 18% 17% Unit $595,000 7% 52% 42% Source: PropTrack | 10 yr price growth – change in price over past year compared to 2015. Rent – weekly median price. Vacancy rate – percentage of available rentals (filter: minimum 5 vacant properties in suburb). Gross rental yield – median percentage of a property’s value received as rental income. N/A – not enough data for accurate reading. Invest 10 year price growth Rent Change Vacancy rate Gross yield House 91% $720 1% NA 2.9% Unit 56% $538 2% NA 5.0%
Jump back to the top
Tasmania
Tasmania’s property market is yet to return to its Covid-era record highs, with the median property price in Hobart around 3% below the previous peak. But the pace of growth is rising compared to a year ago, and these 8 suburbs could be ones to watch.
Acton
Population Distance to capital Main demographic 1,377 244km 25-29
Nominated by John McGrath
Nominated for: Affordability, investment prospects
Acton is a suburb of Burnie in Tasmania’s northwest that’s well placed to take advantage of growth in the busy port city, which handles the bulk of the state’s container shipping.
It’s also an affordable investment option, with a median house price just above $400,000.
Acton is a suburb of Burnie, which has affordable freestanding homes despite more-than doubling in the past decade. Picture: realestate.com.au
John McGrath said the suburb was drawing investor interest amid strong rental demand, with infrastructure upgrades and clean energy investment in the area providing tailwinds for growth.
“With a median rental yield of 5.4% and median home prices up 94.9% in five years, Acton is emerging as a standout in Tasmania’s property market,” he said.
Freestanding homes account for close to 90% of housing stock across the Burnie region, so there isn’t enough sales data to provide stats on units in the tables below.
Source: PropTrack | Median price – rolling 12 months ending Nov 2025. Supply – YoY change in listings. Demand – YoY change in number of key enquiries per listing. N/A – not enough data for accurate reading. Buy Median price Annual change Supply Demand House $411,000 16% -24% 182% Unit N/A N/A N/A N/A Source: PropTrack | 10 yr price growth – change in price over past year compared to 2015. Rent – weekly median price. Vacancy rate – percentage of available rentals (filter: minimum 5 vacant properties in suburb). Gross rental yield – median percentage of a property’s value received as rental income. Invest 10 year price growth Rent Change Vacancy rate Gross yield House 154% $405 7% N/A 5.1% Unit N/A N/A N/A N/A N/A
Battery Point
Population Distance to capital Main demographic 2,096 1km 25-29
Nominated by Matt Lahood and John McGrath
Nominated for: Location, amenity
Battery Point is one of Tasmania’s most prestigious and tightly-held suburbs, with its character-filled streets, sandstone cottages and heritage terraces, as well as boutiques and cafes.
Major drawcards are its position right next to the city and the waterfront, as well as the lively markets along Salamanca Place.
Home prices in Battery Point now offer good value according to John McGrath. Picture: realestate.com.au
Although it’s one of the city’s priciest suburbs with a median house price of almost $1.6 million, John McGrath said the suburb offered good buying after prices recently retreated.
“Despite its heritage charm and waterfront lifestyle, this prestigious suburb is now trading at a discount,” he said.
Also nominated by The Agency’s Matt Lahood, Battery Point is one of just seven ‘high conviction’ suburbs in this year’s Hot 100 – nominated by multiple experts.
“Battery Point continues to shine as one of Tasmania’s most cherished suburbs, perfectly positioned to be a real hotspot in 2026,” Mr Lahood said.
“With only a few homes coming to market there is strong interest from both local and interstate buyers,” he said.
“There is added excitement with the plans for the AFL stadium and permanent Tasmanian team, the energy in the area is growing.”
Source: PropTrack | Median price – rolling 12 months ending Nov 2025. Supply – YoY change in listings. Demand – YoY change in number of key enquiries per listing. Buy Median price Annual change Supply Demand House $1,588,000 18% -14% 29% Unit $750,000 -6% 14% 19% Source: PropTrack | 10 yr price growth – change in price over past year compared to 2015. Rent – weekly median price. Vacancy rate – percentage of available rentals (filter: minimum 5 vacant properties in suburb). Gross rental yield – median percentage of a property’s value received as rental income. N/A – not enough data for accurate reading. Invest 10 year price growth Rent Change Vacancy rate Gross yield House 95% $825 29% N/A 3.6% Unit 70% $575 13% 1.6% 4.2%
Brighton
Population Distance to capital Main demographic 4,983 21km 25-29
Nominated by Mathew Tiller
Nominated for: Affordability, family appeal
Situated in Hobart’s northern outskirts, Brighton offers a mix of recently built and established homes at affordable prices.
The suburb has grown rapidly, with its population increasing by more than 20% in five years.
Mathew Tiller said Brighton has become a go-to for first-home buyers looking for a freestanding house at an achievable price.
“New community infrastructure and schools have lifted day‑to‑day liveability,” he said.
“Industrial and logistics investment nearby means there are real local jobs, not just lifestyle buyers.”
“With limited comparable options at the same price point, enquiry has stayed strong.”
Source: PropTrack | Median price – rolling 12 months ending Nov 2025. Supply – YoY change in listings. Demand – YoY change in number of key enquiries per listing. Buy Median price Annual change Supply Demand House $600,000 1% 1% 35% Unit $485,000 1% -18% 21% Source: PropTrack | 10 yr price growth – change in price over past year compared to 2015. Rent – weekly median price. Vacancy rate – percentage of available rentals (filter: minimum 5 vacant properties in suburb). Gross rental yield – median percentage of a property’s value received as rental income. N/A – not enough data for accurate reading. Invest 10 year price growth Rent Change Vacancy rate Gross yield House 118% $560 6% N/A 4.9% Unit 137% $460 2% N/A 5.3%
Invermay
Population Distance to capital Main demographic 3,498 164km 25-29
Nominated by Matt Lahood
Nominated for: Affordability, infrastructure
Invermay is just north of the Launceston CBD, but provides a more affordable alternative, with a median house price that’s about $150,000 lower.
It’s also next to the University of Tasmania’s Inversek campus, which bolsters rental demand, while the UTAS Stadium is set to become the Tasmania Devils’ home ground once the team enters the AFL in 2028.
Matt Lahood predicts investor interest will increase in the year ahead.
“Invermay will see strong growth in 2026 because it is attractive to investors due to its strong yield and close proximity to the CBD, university and York Park stadium which are all in walking distance,” he said.
Most properties are freestanding weatherboard houses, many with the potential to add value, Mr Lahood said.
“The area’s mixture of Victorian and Federation homes are ripe for renovation.”
Source: PropTrack | Median price – rolling 12 months ending Nov 2025. Supply – YoY change in listings. Demand – YoY change in number of key enquiries per listing. N/A – not enough data for accurate reading. Buy Median price Annual change Supply Demand House $470,000 4% 15% 97% Unit N/A N/A N/A N/A Source: PropTrack | 10 yr price growth – change in price over past year compared to 2015. Rent – weekly median price. Vacancy rate – percentage of available rentals (filter: minimum 5 vacant properties in suburb). Gross rental yield – median percentage of a property’s value received as rental income. Invest 10 year price growth Rent Change Vacancy rate Gross yield House 107% $450 0% N/A 4.7% Unit N/A $370 -1% N/A 4.9%
Kingston
Population Distance to capital Main demographic 12,288 10.5km 25-29
Nominated by Belinda Connor and Samantha Spilsbury
Nominated for: Affordability, population growth
About 15 minutes south of Hobart, Kingston is a popular beachside suburb with more affordable property prices than many inner suburbs.
The large and rapidly growing suburb is serviced by several shopping centres, as well as a number of public and private schools.
But it’s the recent investment in the Kingsborough Sports Centre that could give the area a major boost, according to Belinda Connor.
“The area has seen a resurgence in interest off the back of announcements of a new high performance training facility for the Tasmanian Jack Jumpers and upcoming Tasmania Devils Football club,” she said.
“Players and support staff have already started snapping up opportunities near the beach and surrounding suburbs in anticipation of both clubs moving into the area.”
Kingston was also nominated by REBAA Tas state representative Samantha Spilsbury, who noted it’s one of Tasmania’s “fastest-growing residential corridors, attracting both families and professionals seeking value within easy commute distance.”
She said the “consistent performer” offers “further uplift potential” as southern transport and community projects progress.
Source: PropTrack | Median price – rolling 12 months ending Nov 2025. Supply – YoY change in listings. Demand – YoY change in number of key enquiries per listing. Buy Median price Annual change Supply Demand House $739,000 0% -19% 48% Unit $620,000 3% -7% 36% Source: PropTrack | 10 yr price growth – change in price over past year compared to 2015. Rent – weekly median price. Vacancy rate – percentage of available rentals (filter: minimum 5 vacant properties in suburb). Gross rental yield – median percentage of a property’s value received as rental income. N/A – not enough data for accurate reading. Invest 10 year price growth Rent Change Vacancy rate Gross yield House 110% $620 7% N/A 4.4% Unit 109% $505 -1% N/A 4.2%
Legana
Population Distance to capital Main demographic 4,769 171km 50-54
Nominated by Samantha Spilsbury
Nominated for: Family appeal, affordability
About 12km north of Launceston, Legana has slowly transformed from a rural town into a popular family-friendly suburb, with significant housing development in recent years.
But its scenic setting on the Tamar River and the surrounding vineyards and farms mean it still maintains much of its country town feel.
Sam Spilsbury said Legana has strong growth prospects, underpinned by population growth.
“Legana offers a semi-rural lifestyle and relative value compared to central Launceston suburbs,” she said.
“Ongoing land releases and residential development activity support steady population growth and rental market resilience.”
A new primary school has recently opened, which signals a demographic change towards young families and professionals, Ms Spilsbury added.
Source: PropTrack | Median price – rolling 12 months ending Nov 2025. Supply – YoY change in listings. Demand – YoY change in number of key enquiries per listing. Buy Median price Annual change Supply Demand House $698,000 -6% 5% 47% Unit $558,000 13% 0% 9% Source: PropTrack | 10 yr price growth – change in price over past year compared to 2015. Rent – weekly median price. Vacancy rate – percentage of available rentals (filter: minimum 5 vacant properties in suburb). Gross rental yield – median percentage of a property’s value received as rental income. N/A – not enough data for accurate reading. Invest 10 year price growth Rent Change Vacancy rate Gross yield House 91% $590 7% N/A 4.6% Unit 101% $520 11% N/A 5.1%
New Norfolk
Population Distance to capital Main demographic 6,037 24km 30-34
Nominated by Samantha Spilsbury
Nominated for: Affordability
New Norfolk on Hobart’s northern fringe is the twelfth oldest European settlement in Australia, having been settled by former inhabitants of Norfolk Island in the early 1800s.
More recently it’s become a culinary destination and is home to celebrated restaurant The Agrarian Kitchen as well as a number of distilleries and breweries.
New Norfolk’s affordable homes and charming setting is attracting buyers from greater Hobart. Picture: realestate.com.au
Its sub-$500,000 median house price makes it a great entry-level opportunity, according to Sam Spilsbury, who said it was well-position to benefit from spillover demand from the greater Hobart area.
Its riverside setting, heritage charm and access to the natural attractions of the Derwent Valley further boost its appeal.
Source: PropTrack | Median price – rolling 12 months ending Nov 2025. Supply – YoY change in listings. Demand – YoY change in number of key enquiries per listing. Buy Median price Annual change Supply Demand House $470,000 1% 2% 75% Unit $425,000 1% -26% 48% Source: PropTrack | 10 yr price growth – change in price over past year compared to 2015. Rent – weekly median price. Vacancy rate – percentage of available rentals (filter: minimum 5 vacant properties in suburb). Gross rental yield – median percentage of a property’s value received as rental income. N/A – not enough data for accurate reading. Invest 10 year price growth Rent Change Vacancy rate Gross yield House 135% $450 0% 1.8% 5.5% Unit N/A $370 -7% N/A 5.3%
Sorell
Population Distance to capital Main demographic 3597 22km 30-34
Nominated by Mathew Tiller
Nominated for: Affordability, family appeal
Situated about a 25-minute drive east of the Hobart CBD, Sorell has transformed from a small town into regional hub and affordable commuter suburb.
Housing consists of a mix of older and recently-built houses, along with some larger acreage properties.
Population growth in the wider Sorell local government area is projected to be the fastest in the state, according to a 2024 Tasmanian government report.
Mathew Tiller said population growth would support value growth in the outer suburb, while recent road upgrades along the Tasman Highway have improved traffic flow and eased commuting pressure.
“Families like the newer housing, schools and shopping without paying inner‑Hobart money,” Mr Tiller said.
“Downsizers also target the area for single‑level homes and convenience.”
Source: PropTrack | Median price – rolling 12 months ending Nov 2025. Supply – YoY change in listings. Demand – YoY change in number of key enquiries per listing. Buy Median price Annual change Supply Demand House $710,000 10% 36% 57% Unit $515,000 7% 7% 62% Source: PropTrack | 10 yr price growth – change in price over past year compared to 2015. Rent – weekly median price. Vacancy rate – percentage of available rentals (filter: minimum 5 vacant properties in suburb). Gross rental yield – median percentage of a property’s value received as rental income. N/A – not enough data for accurate reading. Invest 10 year price growth Rent Change Vacancy rate Gross yield House 137% $560 5% N/A 4.7% Unit 112% $470 4% N/A 4.9%
Jump back to the top
Northern Territory
The Top End has emerged as a remarkable turnaround story in the past 12 months as investors seek affordable options offering solid yields. With five nominations, the NT has more suburbs in the 2026 Hot 100 than the previous three years combined.
Millner
Population Distance to capital Main demographic 2576 8km 30-34
Nominated by Peter Koulizos
Nominated for: Affordability, gentrification
Centrally located in Darwin’s northern suburbs, Millner provides easy access to the city, beaches and shopping centres and the airport, but is more affordable than neighbouring suburbs.
Spillover demand from pricier Nightcliff could help drive price growth in the future.
Peter Koulizos said there were opportunities for buyers to add value to older properties through renovations.
“The elevated homes in this suburb respond particularly well to simple improvements, such as a deck,” he said.
Source: PropTrack | Median price – rolling 12 months ending Nov 2025. Supply – YoY change in listings. Demand – YoY change in number of key enquiries per listing. Buy Median price Annual change Supply Demand House $610,000 7% -19% 110% Unit $350,000 8% -14% 25% Source: PropTrack | 10 yr price growth – change in price over past year compared to 2015. Rent – weekly median price. Vacancy rate – percentage of available rentals (filter: minimum 5 vacant properties in suburb). Gross rental yield – median percentage of a property’s value received as rental income. N/A – not enough data for accurate reading. Invest 10 year price growth Rent Change Vacancy rate Gross yield House 11% $680 6% N/A 5.5% Unit -3% $500 6% N/A 7.3%
Rapid Creek
Population Distance to capital Main demographic 3261 9km 30-34
Nominated by Peter Koulizos
Nominated for: Affordability, gentrification
Known for its leafy foreshore park and beaches and its weekend fresh food markets, Rapid Creek offers a coastal lifestyle with urban convenience.
It’s also home to The Essington School, one of the Darwin’s top private schools.
Rapid Creek is slightly more affordable than neighbouring Nightcliff. Picture: realestate.com.au
Peter Koulizos said the suburb’s position in the popular northern suburbs created strong rental demand.
“The nearby Charles Darwin University provides a large pool of both students and lecturers, who are looking to live close to the university,” he said. “This places upward pressure on rents.”
Properties are a little more affordable than neighbouring, Nightcliff, which Darwin’s priciest suburb.
Source: PropTrack | Median price – rolling 12 months ending Nov 2025. Supply – YoY change in listings. Demand – YoY change in number of key enquiries per listing. Buy Median price Annual change Supply Demand House $763,000 -5% -26% 20% Unit $440,000 5% -18% 42% Source: PropTrack | 10 yr price growth – change in price over past year compared to 2015. Rent – weekly median price. Vacancy rate – percentage of available rentals (filter: minimum 5 vacant properties in suburb). Gross rental yield – median percentage of a property’s value received as rental income. N/A – not enough data for accurate reading. Invest 10 year price growth Rent Change Vacancy rate Gross yield House 17% $750 7% N/A 5.3% Unit 5% $520 8% 1.1% 7.2%
Rosebery
Population Distance to capital Main demographic 4127 17km 30-34
Nominated by Mathew Tiller
Nominated for: Affordability
A modern suburb in the Palmerston region in Darwin’s southeast, Rosebery’s family-friendly vibe and affordability make it a top pick for Mathew Tiller.
“Rosebery attracts local upgraders who want a family home close to schools, open space and Palmerston services,” he said.
“Buyers see it as good value compared with Darwin’s inner suburbs, but still within reach of work.”
Mr Tiller said the suburb’s solid base of owner-occupiers would help support property values through softer cycles.
“Well‑presented houses tend to move without sitting for long,” he said.
Source: PropTrack | Median price – rolling 12 months ending Nov 2025. Supply – YoY change in listings. Demand – YoY change in number of key enquiries per listing. Buy Median price Annual change Supply Demand House $645,000 10% -38% 36% Unit $418,000 26% -28% 58% Source: PropTrack | 10 yr price growth – change in price over past year compared to 2015. Rent – weekly median price. Vacancy rate – percentage of available rentals (filter: minimum 5 vacant properties in suburb). Gross rental yield – median percentage of a property’s value received as rental income. N/A – not enough data for accurate reading. Invest 10 year price growth Rent Change Vacancy rate Gross yield House 1% $733 5% N/A 5.7% Unit N/A $530 2% 2.5% 6.9%
Parap
Population Distance to capital Main demographic 2819 3.5km 30-34
Nominated by Mathew Tiller
Nominated for: Location, amenity
Situated close to the CBD, Parap gets points for its convenient location and laid-back atmosphere.
“Parap is one of Darwin’s lifestyle suburbs, known for cafés, the weekend markets and easy access to the waterfront,” Mathew Tiller said.
Rental demand in Parap has stayed consistently tight as a result of its inner position, Mr Tiller said.
“The suburb draws professionals who want to be near the city but still have that tropical village feel.”
Apartments outnumber houses and offer a low-maintenance investment option with strong return.
“Units here appeal to investors chasing yield and to downsizers who want low‑maintenance living close to amenity.”
Source: PropTrack | Median price – rolling 12 months ending Nov 2025. Supply – YoY change in listings. Demand – YoY change in number of key enquiries per listing. Buy Median price Annual change Supply Demand House $880,000 -7% -21% 40% Unit $404,000 -4% 5% 61% Source: PropTrack | 10 yr price growth – change in price over past year compared to 2015. Rent – weekly median price. Vacancy rate – percentage of available rentals (filter: minimum 5 vacant properties in suburb). Gross rental yield – median percentage of a property’s value received as rental income. N/A – not enough data for accurate reading. Invest 10 year price growth Rent Change Vacancy rate Gross yield House 6% $820 -4% N/A 5.4% Unit -23% $595 4% 2.4% 6.8%
Zuccoli
Population Distance to capital Main demographic 4131 18km 12.9
Nominated by Mathew Tiller
Nominated for: Rental demand
Located on the outskirts of Palmerston about 20km from the Darwin CBD, Zuccoli is a recently developed suburb where buyers can find newer homes in a master-planned community at more affordable prices than closer to the city.
New development suburb Zuccoli offers family-friendly living at more affordable prices than inner city Darwin. Picture: realestate.com.au
Mathew Tiller said the suburb’s liveability and rental demand made it appealing to both homeowners and investors.
“Zuccoli in Palmerston is popular with young families who want a newer home, schools and parks without stretching to inner‑Darwin prices,” said Mathew Tiller.
“There’s strong rental demand from defence, health and services workers.”
Source: PropTrack | Median price – rolling 12 months ending Nov 2025. Supply – YoY change in listings. Demand – YoY change in number of key enquiries per listing. N/A – not enough data for accurate reading Buy Median price Annual change Supply Demand House $590,000 12% -22% 74% Unit $453,000 -9% 20% N/A Source: PropTrack | 10 yr price growth – change in price over past year compared to 2015. Rent – weekly median price. Vacancy rate – percentage of available rentals (filter: minimum 5 vacant properties in suburb). Gross rental yield – median percentage of a property’s value received as rental income. Invest 10 year price growth Rent Change Vacancy rate Gross yield House 149% $750 7% 2.8% 7.2% Unit N/A $660 5% N/A 6.5%
Jump back to the top
Note:
The information published in this report is of a general nature only and does not consider your personal objectives, financial situation or particular needs. Where indicated, third parties have written and supplied the content and we are not responsible for it. We make no warranty as to the accuracy, completeness or reliability of the information, nor do we accept any liability or responsibility arising in any way from omissions or errors contained in the content. We strongly recommend that you obtain independent advice before making any property decisions.